Citibank 2008 Annual Report Download - page 206
Download and view the complete annual report
Please find page 206 of the 2008 Citibank annual report below. You can navigate through the pages in the report by either clicking on the pages listed below, or by using the keyword search tool below to find specific information within the annual report.-
 1
1 -
2
-
3
-
4
-
5
-
6
-
7
-
8
-
9
-
10
-
11
-
12
-
13
-
14
-
15
-
16
-
17
-
18
-
19
-
20
-
21
-
22
-
23
-
24
-
25
-
26
-
27
-
28
-
29
-
30
-
31
-
32
-
33
-
34
-
35
-
36
-
37
-
38
-
39
-
40
-
41
-
42
-
43
-
44
-
45
-
46
-
47
-
48
-
49
-
50
-
51
-
52
-
53
-
54
-
55
-
56
-
57
-
58
-
59
-
60
-
61
-
62
-
63
-
64
-
65
-
66
-
67
-
68
-
69
-
70
-
71
-
72
-
73
-
74
-
75
-
76
-
77
-
78
-
79
-
80
-
81
-
82
-
83
-
84
-
85
-
86
-
87
-
88
-
89
-
90
-
91
-
92
-
93
-
94
-
95
-
96
-
97
-
98
-
99
-
100
-
101
-
102
-
103
-
104
-
105
-
106
-
107
-
108
-
109
-
110
-
111
-
112
-
113
-
114
-
115
-
116
-
117
-
118
-
119
-
120
-
121
-
122
-
123
-
124
-
125
-
126
-
127
-
128
-
129
-
130
-
131
-
132
-
133
-
134
-
135
-
136
-
137
-
138
-
139
-
140
-
141
-
142
-
143
-
144
-
145
-
146
-
147
-
148
-
149
-
150
-
151
-
152
-
153
-
154
-
155
-
156
-
157
-
158
-
159
-
160
-
161
-
162
-
163
-
164
-
165
-
166
-
167
-
168
-
169
-
170
-
171
-
172
-
173
-
174
-
175
-
176
-
177
-
178
-
179
-
180
-
181
-
182
-
183
-
184
-
185
-
186
-
187
-
188
-
189
-
190
-
191
-
192
-
193
-
194
-
195
-
 196
196 -
 197
197 -
 198
198 -
 199
199 -
 200
200 -
 201
201 -
 202
202 -
 203
203 -
 204
204 -
 205
205 -
 206
206 -
 207
207 -
 208
208 -
 209
209 -
 210
210 -
 211
211 -
 212
212 -
 213
213 -
 214
214 -
 215
215 -
 216
216 -
217
-
218
-
219
-
220
-
221
-
222
-
223
-
224
-
225
-
226
-
227
-
228
-
229
-
230
-
231
-
232
-
233
-
234
-
235
-
236
-
237
-
238
-
239
-
240
-
241
-
242
-
243
-
244
-
245
-
246
-
247
-
248
-
249
-
250
-
251
-
252
 |
 |
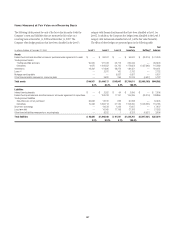
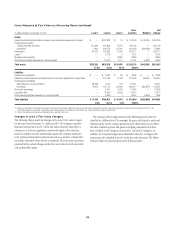
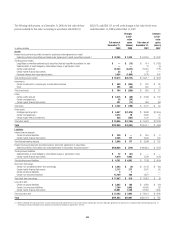
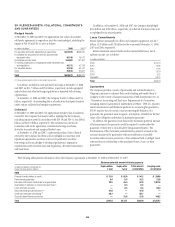
The following is a discussion of the changes to the Level 3 balances for
each of the roll-forward tables presented above.
The significant changes from December 31, 2007 to December 31, 2008 in
Level 3 assets and liabilities are due to:
- A net decrease in trading securities and loans of $24.8 billion that
was driven by:
(i) Net realized and unrealized losses of $28.1 billion
recorded in Principal transactions, which composed
mostly of write-downs recognized on various trading
securities including ABCP of $9 billion;
(ii) Net transfers in of $7.4 billion, which consisted of
approximately $26 billion of net transfers in from Level 2
to Level 3 as the availability of observable pricing inputs
continued to decline due to the current credit crisis, offset
by transfers out of Level 3 of approximately $19 billion
primarily related to Level 3 trading inventory being
reclassified to held-to-maturity investments during the
fourth quarter of 2008; and
(iii) Net settlements of trading securities of $4.2 billion in
Level 3.
- The shift in the Level 3 net unrealized gains/(losses) from trading
derivatives driven by:
(i) A net gain of $7.8 billion relating to complex derivative
contracts, such as those linked to credit, equity and
commodity exposures. These gains include both realized
and unrealized gains during 2008 and are partially offset
by losses recognized in instruments that have been
classified in Levels 1 and 2;
(ii) $2.2 billion in net transfers in and/or out of Level 3,
representing a net transfer in of derivative liabilities
during the year.
- The increase in Level 3 Investments of $11.2 billion primarily
resulted from:
(i) The addition of $10.3 billion from net purchases,
issuances and settlements, which included $8.7 billion in
senior debt securities retained by the Company from its
sale of a corporate loan portfolio that included highly
leveraged loans during the second quarter of 2008, plus
$3 billion of ARS securities purchased from GWM clients,
in accordance with the Auction Rate Securities settlement
agreement ;
(ii) The net transfer in of investment securities from Level 2 to
Level 3 of $5.8 billion, as the availability of observable
pricing inputs continued to decline due to the current
credit crisis; and
(iii) Net losses recognized of $4.9 billion which was recorded
in Accumulated other comprehensive income (loss)
primarily related to Alt-A MBS classified as
available-for-sale investments.
- The decrease in Mortgage Servicing Rights of $2.7 billion was
primarily attributed to mark-to-market losses recognized in the
portfolio due to decreases in the mortgage interest rates and
increases in refinancing.
- The increase in the Level 3 balance for Securities sold under
agreements to repurchase of $5 billion is driven by a $6.2 billion
increase from net transfers in as the continued credit crisis
impacted the availability of observable inputs for the underlying
securities related to this liability. This was offset by a reduction
from net settlements of $1.4 billion.
- The decrease in Level 3 short-term borrowings of $3.7 billion is due
to net transfers out of $1.8 billion as valuation methodology inputs
considered to be unobservable were determined not to be significant
to the overall valuation. In addition, net payments of $1.8 billion
were made during 2008 against the Level 3 short-term debt
obligations.
- The increase in Level 3 Long-term debt of $2.2 billion is driven by:
(i) The net transfers in of $38.8 billion, substantially all of
which related to the transfer of consolidated SIV debt in
the first quarter of 2008, as the availability of observable
inputs continued to decline due to the current crisis; offset
by
(ii) $2.2 billion in gains recognized as credit spreads widened
during the year;
(iii) $34.3 billion decrease from net settlements/payments.
Included in these settlements were $21 billion of
payments made on maturing SIV debt and the
replacement of $17 billion of non-recourse, consolidated
SIV debt classified as Level 3 with Citigroup debt classified
as Level 2. This replacement occurred in connection with
the purchase of the SIV assets by the Company in
November 2008.
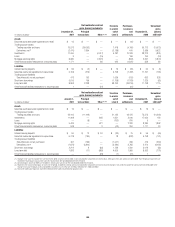
The significant changes from January 1, 2007 to December 31, 2007 in
Level 3 assets and liabilities are due to:
- The increase in trading securities and loans of $53.2 billion that
was driven primarily by:
(i) The net additions/purchases of $43.5 billion, which
included asset-backed commercial paper purchases where
the Company had liquidity puts and assets bought with
Nikko Cordial acquisitions
(ii) The net transfers in of $21.1 billion for items previously
classified as Level 2 as prices and other valuation inputs
became unobservable with the market dislocation crises
that began in the second half of 2007; and
(iii) Mark-to-market losses of $11.4 billion primarily
attributable to writedowns on super senior tranches,
junior tranches, ABCP and other related inventory.
- The increase in Level 3 Investments of $5.6 billion, primarily
resulting from the acquisition of Nikko Cordial.
- The increase in Mortgage servicing rights of $2.9 billion which was
primarily due to the first quarter 2007 acquisition of ABN AMRO
Mortgage Group.
- The decrease in net derivative trading account assets of $4.4 billion
was due to mark-to-market losses and net purchases/originations
of $3.8 billion, offset by net transfers in of Level 3 trading derivative
liabilities of $3.3 billion.
200