Citibank 2008 Annual Report Download - page 232
Download and view the complete annual report
Please find page 232 of the 2008 Citibank annual report below. You can navigate through the pages in the report by either clicking on the pages listed below, or by using the keyword search tool below to find specific information within the annual report.-
 1
1 -
2
-
3
-
4
-
5
-
6
-
7
-
8
-
9
-
10
-
11
-
12
-
13
-
14
-
15
-
16
-
17
-
18
-
19
-
20
-
21
-
22
-
23
-
24
-
25
-
26
-
27
-
28
-
29
-
30
-
31
-
32
-
33
-
34
-
35
-
36
-
37
-
38
-
39
-
40
-
41
-
42
-
43
-
44
-
45
-
46
-
47
-
48
-
49
-
50
-
51
-
52
-
53
-
54
-
55
-
56
-
57
-
58
-
59
-
60
-
61
-
62
-
63
-
64
-
65
-
66
-
67
-
68
-
69
-
70
-
71
-
72
-
73
-
74
-
75
-
76
-
77
-
78
-
79
-
80
-
81
-
82
-
83
-
84
-
85
-
86
-
87
-
88
-
89
-
90
-
91
-
92
-
93
-
94
-
95
-
96
-
97
-
98
-
99
-
100
-
101
-
102
-
103
-
104
-
105
-
106
-
107
-
108
-
109
-
110
-
111
-
112
-
113
-
114
-
115
-
116
-
117
-
118
-
119
-
120
-
121
-
122
-
123
-
124
-
125
-
126
-
127
-
128
-
129
-
130
-
131
-
132
-
133
-
134
-
135
-
136
-
137
-
138
-
139
-
140
-
141
-
142
-
143
-
144
-
145
-
146
-
147
-
148
-
149
-
150
-
151
-
152
-
153
-
154
-
155
-
156
-
157
-
158
-
159
-
160
-
161
-
162
-
163
-
164
-
165
-
166
-
167
-
168
-
169
-
170
-
171
-
172
-
173
-
174
-
175
-
176
-
177
-
178
-
179
-
180
-
181
-
182
-
183
-
184
-
185
-
186
-
187
-
188
-
189
-
190
-
191
-
192
-
193
-
194
-
195
-
196
-
197
-
198
-
199
-
200
-
201
-
202
-
203
-
204
-
205
-
206
-
207
-
208
-
209
-
210
-
211
-
212
-
213
-
214
-
215
-
216
-
217
-
218
-
219
-
220
-
221
-
 222
222 -
 223
223 -
 224
224 -
 225
225 -
 226
226 -
 227
227 -
 228
228 -
 229
229 -
 230
230 -
 231
231 -
 232
232 -
 233
233 -
 234
234 -
 235
235 -
 236
236 -
 237
237 -
 238
238 -
 239
239 -
 240
240 -
 241
241 -
 242
242 -
243
-
244
-
245
-
246
-
247
-
248
-
249
-
250
-
251
-
252
 |
 |

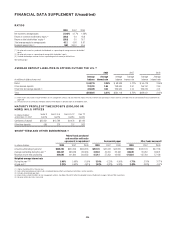
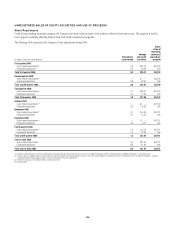
FINANCIAL DATA SUPPLEMENT (Unaudited)
RATIOS
2008 2007 2006
Net income to average assets (1.28)% 0.17% 1.28%
Return on common stockholders’ equity (1) (28.8) 2.9 18.8
Return on total stockholders’ equity (2) (20.9) 3.0 18.7
Total average equity to average assets 6.12 5.66 6.87
Dividends payout ratio (3) NM 300.0 45.5
(1) Based on net income less preferred stock dividends as a percentage of average common stockholders’
equity.
(2) Based on net income as a percentage of average total stockholders’ equity.
(3) Dividends declared per common share as a percentage of net income per diluted share.
NM Not Meaningful
AVERAGE DEPOSIT LIABILITIES IN OFFICES OUTSIDE THE U.S. (1)
2008 2007 2006
In millions of dollars at year end
Average
balance
Average
interest rate
Average
balance
Average
interest rate
Average
balance
Average
interest rate
Banks $ 60,315 3.25% $ 68,538 4.72% $ 50,478 3.56%
Other demand deposits 212,781 1.85 208,634 2.57 156,197 2.53
Other time and savings deposits (2) 243,305 3.53 256,946 4.54 229,376 4.01
Total $516,401 2.81% $534,118 3.79% $436,051 3.42%
(1) Interest rates and amounts include the effects of risk management activities and also reflect the impact of the local interest rates prevailing in certain countries. See Note 24 to the Consolidated Financial Statements on
page 189.
(2) Primarily consists of certificates of deposit and other time deposits in denominations of $100,000 or more.
MATURITY PROFILE OF TIME DEPOSITS ($100,000 OR
MORE) IN U.S. OFFICES
In millions of dollars
at December 31, 2008
Under 3
months
Over 3 to 6
months
Over 6 to 12
months
Over 12
months
Certificates of deposit $22,951 $12,769 $2,078 $2,199
Other time deposits 585 216 157 863
SHORT-TERM AND OTHER BORROWINGS (1)
Federal funds purchased
and securities sold under
agreements to repurchase(2) Commercial paper Other funds borrowed(2)
In millions of dollars 2008 2007 2006 2008 2007 2006 2008 2007 2006
Amounts outstanding at year end $205,293 $304,243 $349,235 $29,125 $37,343 $43,695 $97,566 $109,145 $57,138
Average outstanding during the year (3) 284,467 386,628 290,663 33,533 45,204 32,468 86,849 95,262 38,691
Maximum month-end outstanding 354,685 441,844 349,235 41,212 57,303 43,695 121,834 145,783 57,138
Weighted-average interest rate
During the year (3) (4) 3.98% 5.96% 6.00% 3.10% 5.23% 4.96% 1.71% 2.76% 3.71%
At year end (5) 2.22% 4.52% 4.81% 1.67% 4.92% 5.28% 2.40% 3.62% 4.47%
(1) Original maturities of less than one year.
(2) Rates reflect prevailing local interest rates including inflationary effects and monetary correction in certain countries.
(3) Excludes discontinued operations.
(4) Interest rates include the effects of risk management activities. See Notes 20 and 24 to the Consolidated Financial Statements on pages 169 and 189, respectively.
(5) Based on contractual rates at year end.
226