Citibank 2008 Annual Report Download - page 122
Download and view the complete annual report
Please find page 122 of the 2008 Citibank annual report below. You can navigate through the pages in the report by either clicking on the pages listed below, or by using the keyword search tool below to find specific information within the annual report.-
 1
1 -
2
-
3
-
4
-
5
-
6
-
7
-
8
-
9
-
10
-
11
-
12
-
13
-
14
-
15
-
16
-
17
-
18
-
19
-
20
-
21
-
22
-
23
-
24
-
25
-
26
-
27
-
28
-
29
-
30
-
31
-
32
-
33
-
34
-
35
-
36
-
37
-
38
-
39
-
40
-
41
-
42
-
43
-
44
-
45
-
46
-
47
-
48
-
49
-
50
-
51
-
52
-
53
-
54
-
55
-
56
-
57
-
58
-
59
-
60
-
61
-
62
-
63
-
64
-
65
-
66
-
67
-
68
-
69
-
70
-
71
-
72
-
73
-
74
-
75
-
76
-
77
-
78
-
79
-
80
-
81
-
82
-
83
-
84
-
85
-
86
-
87
-
88
-
89
-
90
-
91
-
92
-
93
-
94
-
95
-
96
-
97
-
98
-
99
-
100
-
101
-
102
-
103
-
104
-
105
-
106
-
107
-
108
-
109
-
110
-
111
-
 112
112 -
 113
113 -
 114
114 -
 115
115 -
 116
116 -
 117
117 -
 118
118 -
 119
119 -
 120
120 -
 121
121 -
 122
122 -
 123
123 -
 124
124 -
 125
125 -
 126
126 -
 127
127 -
 128
128 -
 129
129 -
 130
130 -
 131
131 -
 132
132 -
133
-
134
-
135
-
136
-
137
-
138
-
139
-
140
-
141
-
142
-
143
-
144
-
145
-
146
-
147
-
148
-
149
-
150
-
151
-
152
-
153
-
154
-
155
-
156
-
157
-
158
-
159
-
160
-
161
-
162
-
163
-
164
-
165
-
166
-
167
-
168
-
169
-
170
-
171
-
172
-
173
-
174
-
175
-
176
-
177
-
178
-
179
-
180
-
181
-
182
-
183
-
184
-
185
-
186
-
187
-
188
-
189
-
190
-
191
-
192
-
193
-
194
-
195
-
196
-
197
-
198
-
199
-
200
-
201
-
202
-
203
-
204
-
205
-
206
-
207
-
208
-
209
-
210
-
211
-
212
-
213
-
214
-
215
-
216
-
217
-
218
-
219
-
220
-
221
-
222
-
223
-
224
-
225
-
226
-
227
-
228
-
229
-
230
-
231
-
232
-
233
-
234
-
235
-
236
-
237
-
238
-
239
-
240
-
241
-
242
-
243
-
244
-
245
-
246
-
247
-
248
-
249
-
250
-
251
-
252
 |
 |

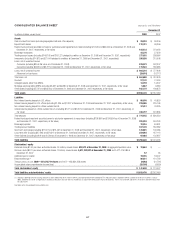
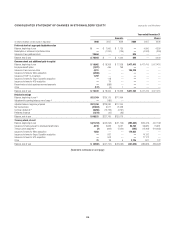
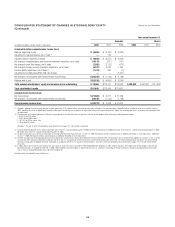
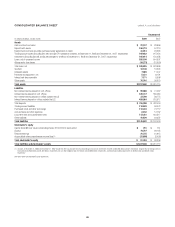
CONSOLIDATED FINANCIAL STATEMENTS
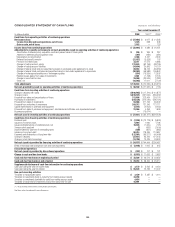
CONSOLIDATED STATEMENT OF INCOME Citigroup Inc. and Subsidiaries
Year ended December 31
In millions of dollars, except per share amounts 2008 2007 2006
Revenues
Interest revenue $106,655 $121,429 $ 93,611
Interest expense 52,963 76,051 55,683
Net interest revenue $ 53,692 $ 45,378 $ 37,928
Commissions and fees $ 11,227 $ 20,706 $ 18,850
Principal transactions (22,188) (12,086) 7,990
Administration and other fiduciary fees 8,560 9,132 6,903
Realized gains (losses) from sales of investments (2,061) 1,168 1,791
Insurance premiums 3,221 3,062 2,769
Other revenue 342 11,135 10,096
Total non-interest revenues $ (899) $ 33,117 $ 48,399
Total revenues, net of interest expense $ 52,793 $ 78,495 $ 86,327
Provisions for credit losses and for benefits and claims
Provision for loan losses $ 33,674 $ 16,832 $ 6,320
Policyholder benefits and claims 1,403 935 967
Provision for unfunded lending commitments (363) 150 250
Total provisions for credit losses and for benefits and claims $ 34,714 $ 17,917 $ 7,537
Operating expenses
Compensation and benefits $ 32,440 $ 33,892 $ 29,752
Net occupancy 7,125 6,648 5,794
Technology/communication 4,897 4,511 3,741
Advertising and marketing 2,292 2,803 2,471
Restructuring 1,766 1,528 —
Other operating 22,614 10,420 8,543
Total operating expenses $ 71,134 $ 59,802 $ 50,301
Income (loss) from continuing operations before income taxes and minority interest $ (53,055) $ 776 $ 28,489
Provision (benefit) for income taxes (20,612) (2,498) 7,749
Minority interest, net of taxes (349) 285 289
Income (loss) from continuing operations $ (32,094) $ 2,989 $ 20,451
Discontinued operations
Income from discontinued operations $ 1,478 $ 925 $ 1,177
Gain on sale 3,139 — 219
Provision (benefit) for income taxes and minority interest, net of taxes 207 297 309
Income from discontinued operations, net of taxes $ 4,410 $ 628 $ 1,087
Net income (loss) $ (27,684) $ 3,617 $ 21,538
Basic earnings per share (1)
Income (loss) from continuing operations $(6.42) $ 0.60 $ 4.17
Income from discontinued operations, net of taxes 0.83 0.13 0.22
Net income (loss) $(5.59) $ 0.73 $ 4.39
Weighted average common shares outstanding 5,265.4 4,905.8 4,887.3
Diluted earnings per share (1)
Income (loss) from continuing operations $(6.42) $ 0.59 $ 4.09
Income from discontinued operations, net of taxes 0.83 0.13 0.22
Net income (loss) $(5.59) $ 0.72 $ 4.31
Adjusted weighted average common shares outstanding 5,795.1 4,995.3 4,986.1
(1) Diluted shares used in the diluted EPS calculation represent basic shares for 2008 due to the net loss. Using actual diluted shares would result in anti-dilution.
See Notes to the Consolidated Financial Statements.
116