Citibank 2008 Annual Report Download - page 87
Download and view the complete annual report
Please find page 87 of the 2008 Citibank annual report below. You can navigate through the pages in the report by either clicking on the pages listed below, or by using the keyword search tool below to find specific information within the annual report.-
 1
1 -
2
-
3
-
4
-
5
-
6
-
7
-
8
-
9
-
10
-
11
-
12
-
13
-
14
-
15
-
16
-
17
-
18
-
19
-
20
-
21
-
22
-
23
-
24
-
25
-
26
-
27
-
28
-
29
-
30
-
31
-
32
-
33
-
34
-
35
-
36
-
37
-
38
-
39
-
40
-
41
-
42
-
43
-
44
-
45
-
46
-
47
-
48
-
49
-
50
-
51
-
52
-
53
-
54
-
55
-
56
-
57
-
58
-
59
-
60
-
61
-
62
-
63
-
64
-
65
-
66
-
67
-
68
-
69
-
70
-
71
-
72
-
73
-
74
-
75
-
76
-
 77
77 -
 78
78 -
 79
79 -
 80
80 -
 81
81 -
 82
82 -
 83
83 -
 84
84 -
 85
85 -
 86
86 -
 87
87 -
 88
88 -
 89
89 -
 90
90 -
 91
91 -
 92
92 -
 93
93 -
 94
94 -
 95
95 -
 96
96 -
 97
97 -
98
-
99
-
100
-
101
-
102
-
103
-
104
-
105
-
106
-
107
-
108
-
109
-
110
-
111
-
112
-
113
-
114
-
115
-
116
-
117
-
118
-
119
-
120
-
121
-
122
-
123
-
124
-
125
-
126
-
127
-
128
-
129
-
130
-
131
-
132
-
133
-
134
-
135
-
136
-
137
-
138
-
139
-
140
-
141
-
142
-
143
-
144
-
145
-
146
-
147
-
148
-
149
-
150
-
151
-
152
-
153
-
154
-
155
-
156
-
157
-
158
-
159
-
160
-
161
-
162
-
163
-
164
-
165
-
166
-
167
-
168
-
169
-
170
-
171
-
172
-
173
-
174
-
175
-
176
-
177
-
178
-
179
-
180
-
181
-
182
-
183
-
184
-
185
-
186
-
187
-
188
-
189
-
190
-
191
-
192
-
193
-
194
-
195
-
196
-
197
-
198
-
199
-
200
-
201
-
202
-
203
-
204
-
205
-
206
-
207
-
208
-
209
-
210
-
211
-
212
-
213
-
214
-
215
-
216
-
217
-
218
-
219
-
220
-
221
-
222
-
223
-
224
-
225
-
226
-
227
-
228
-
229
-
230
-
231
-
232
-
233
-
234
-
235
-
236
-
237
-
238
-
239
-
240
-
241
-
242
-
243
-
244
-
245
-
246
-
247
-
248
-
249
-
250
-
251
-
252
 |
 |
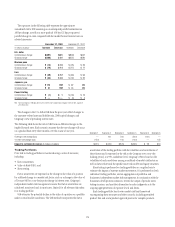
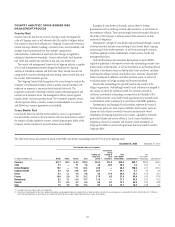
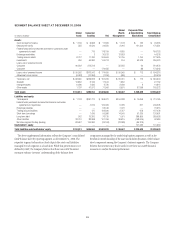
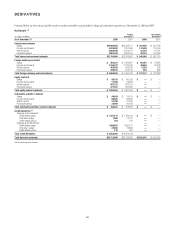
SEGMENT BALANCE SHEET AT DECEMBER 31, 2008
In millions of dollars
Global
Cards
Consumer
Banking ICG
Global
Wealth
Management
Corporate/Other
& Consolidating
Eliminations
Total Citigroup
Consolidated
Assets:
Cash and due from banks $ 1,136 $ 8,683 $ 17,599 $ 1,103 $ 732 $ 29,253
Deposits with banks 535 12,030 34,250 2,016 121,500 170,331
Federal funds sold and securities borrowed or purchased under
agreements to resell — 719 178,759 4,655 — 184,133
Brokerage receivables — 2 30,613 13,663 — 44,278
Trading account assets 8,737 11,780 344,609 10,755 1,754 377,635
Investments 450 46,984 144,413 244 63,929 256,020
Loans, net of unearned income
Consumer 90,562 373,542 — 55,545 24 519,673
Corporate — — 174,455 — 88 174,543
Loans, net of unearned income $ 90,562 $373,542 $ 174,455 $ 55,545 $ 112 $ 694,216
Allowance for loan losses (6,932) (14,950) (7,250) (484) — (29,616)
Total loans, net $ 83,630 $358,592 $ 167,205 $ 55,061 $ 112 $ 664,600
Goodwill 10,832 3,106 11,344 1,850 — 27,132
Intangible assets 6,696 7,085 2,730 3,299 6 19,816
Other assets 1,797 47,572 71,506 6,801 37,596 165,272
Total assets $113,813 $496,553 $1,003,028 $ 99,447 $ 225,629 $1,938,470
Liabilities and equity:
Total deposits $ 1,133 $281,774 $ 368,421 $104,398 $ 18,459 $ 774,185
Federal funds purchased and securities loaned or sold under
agreements to repurchase — 4,515 195,406 5,025 347 205,293
Brokerage payables — — 63,446 7,470 — 70,916
Trading account liabilities — 127 162,636 3,737 978 167,478
Short-term borrowings — 1,435 59,386 14,540 51,330 126,691
Long-term debt 242 15,320 76,130 1,051 266,850 359,593
Other liabilities 28,751 83,998 101,766 36,815 (158,646) 92,684
Net inter-segment funding (lending) 83,687 109,384 (24,163) (73,589) (95,319) —
Stockholders’ equity — — — — 141,630 141,630
Total liabilities and stockholders’ equity $113,813 $496,553 $1,003,028 $ 99,447 $ 225,629 $1,938,470
The above supplemental information reflects the Company’s consolidated
GAAP balance sheet by reporting segment as of December 31, 2008. The
respective segment information closely depicts the assets and liabilities
managed by each segment as of such date. While this presentation is not
defined by GAAP, the Company believes that these non-GAAP financial
measures enhance investors’ understanding of the balance sheet
components managed by the underlying business segments as well as the
beneficial interrelationship of the asset and liability dynamics of the balance
sheet components among the Company’s business segments. The Company
believes that investors may find it useful to see these non-GAAP financial
measures to analyze financial performance.
81