Citibank 2008 Annual Report Download - page 187
Download and view the complete annual report
Please find page 187 of the 2008 Citibank annual report below. You can navigate through the pages in the report by either clicking on the pages listed below, or by using the keyword search tool below to find specific information within the annual report.-
 1
1 -
2
-
3
-
4
-
5
-
6
-
7
-
8
-
9
-
10
-
11
-
12
-
13
-
14
-
15
-
16
-
17
-
18
-
19
-
20
-
21
-
22
-
23
-
24
-
25
-
26
-
27
-
28
-
29
-
30
-
31
-
32
-
33
-
34
-
35
-
36
-
37
-
38
-
39
-
40
-
41
-
42
-
43
-
44
-
45
-
46
-
47
-
48
-
49
-
50
-
51
-
52
-
53
-
54
-
55
-
56
-
57
-
58
-
59
-
60
-
61
-
62
-
63
-
64
-
65
-
66
-
67
-
68
-
69
-
70
-
71
-
72
-
73
-
74
-
75
-
76
-
77
-
78
-
79
-
80
-
81
-
82
-
83
-
84
-
85
-
86
-
87
-
88
-
89
-
90
-
91
-
92
-
93
-
94
-
95
-
96
-
97
-
98
-
99
-
100
-
101
-
102
-
103
-
104
-
105
-
106
-
107
-
108
-
109
-
110
-
111
-
112
-
113
-
114
-
115
-
116
-
117
-
118
-
119
-
120
-
121
-
122
-
123
-
124
-
125
-
126
-
127
-
128
-
129
-
130
-
131
-
132
-
133
-
134
-
135
-
136
-
137
-
138
-
139
-
140
-
141
-
142
-
143
-
144
-
145
-
146
-
147
-
148
-
149
-
150
-
151
-
152
-
153
-
154
-
155
-
156
-
157
-
158
-
159
-
160
-
161
-
162
-
163
-
164
-
165
-
166
-
167
-
168
-
169
-
170
-
171
-
172
-
173
-
174
-
175
-
176
-
 177
177 -
 178
178 -
 179
179 -
 180
180 -
 181
181 -
 182
182 -
 183
183 -
 184
184 -
 185
185 -
 186
186 -
 187
187 -
 188
188 -
 189
189 -
 190
190 -
 191
191 -
 192
192 -
 193
193 -
 194
194 -
 195
195 -
 196
196 -
 197
197 -
198
-
199
-
200
-
201
-
202
-
203
-
204
-
205
-
206
-
207
-
208
-
209
-
210
-
211
-
212
-
213
-
214
-
215
-
216
-
217
-
218
-
219
-
220
-
221
-
222
-
223
-
224
-
225
-
226
-
227
-
228
-
229
-
230
-
231
-
232
-
233
-
234
-
235
-
236
-
237
-
238
-
239
-
240
-
241
-
242
-
243
-
244
-
245
-
246
-
247
-
248
-
249
-
250
-
251
-
252
 |
 |

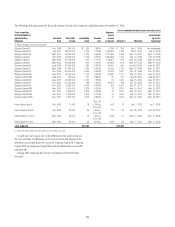
outstanding principal balance and accrued interest of the loan and the cost
of holding and disposing of the underlying property. The Company’s
mortgage loan securitizations are primarily non-recourse, thereby effectively
transferring the risk of future credit losses to the purchasers of the securities
issued by the trust. Securities and Banking retains servicing for a limited
number of its mortgage securitizations.
The Company’s Consumer business provides a wide range of mortgage
loan products to its customers. Once originated, the Company often
securitizes these loans through the use of QSPEs. These QSPEs are funded
through the issuance of Trust Certificates backed solely by the transferred
assets. These certificates have the same average life as the transferred assets.
In addition to providing a source of liquidity and less expensive funding,
securitizing these assets also reduces the Company’s credit exposure to the
borrowers. These mortgage loan securitizations are primarily non-recourse,
thereby effectively transferring the risk of future credit losses to the
purchasers of the securities issued by the trust. However, the Company
generally retains the servicing rights and in certain instances retains
investment securities, interest-only strips and residual interests in future cash
flows from the trusts.
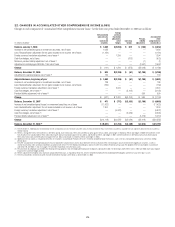
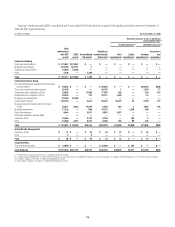
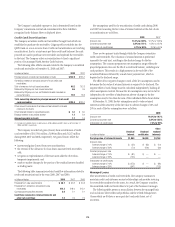
The following tables summarize selected cash flow information related to
mortgage securitizations for the years 2008, 2007 and 2006:
2008
In billions of dollars
U.S. Consumer
mortgages
Securities and
Banking
mortgages
Proceeds from new securitizations $89.2 $6.3
Contractual servicing fees received 2.1 —
Cash flows received on retained interests and
other net cash flows 0.7 0.2
2007
In billions of dollars
U.S. Consumer
mortgages
Securities and
Banking
mortgages
Proceeds from new securitizations $107.2 $40.1
Contractual servicing fees received 1.7 —
Cash flows received on retained interests and
other net cash flows 0.3 0.3
2006
In billions of dollars
U.S. Consumer
mortgages
Securities and
Banking
mortgages
Proceeds from new securitizations $67.5 $31.9
Contractual servicing fees received 1.0 —
Cash flows received on retained interests and
other net cash flows — 0.2
The Company recognized gains (losses) on securitizations of U.S.
Consumer mortgages of $73 million, $(27) million, and $82 million for
2008, 2007 and 2006, respectively. Gains (losses) recognized on the
securitization of Securities and Banking activities during 2008, 2007 and
2006 were $(16) million, $145 million and $302 million, respectively.
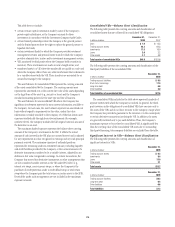
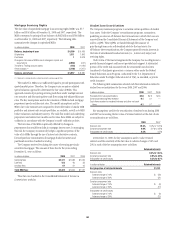
Key assumptions used for the securitization of mortgages during 2008
and 2007 in measuring the fair value of retained interests at the date of sale
or securitization are as follows:
2008
U.S. Consumer
mortgages
Securities and
Banking mortgages
Discount rate 4.5% to 18.2% 5.1% to 39.4%
Constant prepayment rate 3.6% to 32.9% 2.0% to 18.2%
Anticipated net credit losses — 40.0% to 85.0%
2007
U.S. Consumer
mortgages
Securities and
Banking mortgages
Discount rate 9.6% to 17.5% 2.5% to 30.1%
Constant prepayment rate 4.9% to 24.2% 6.1% to 52.5%
Anticipated net credit losses — 10.0% to 100.0%
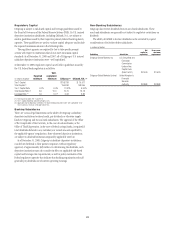
In 2008, U.S. Consumer mortgage rates exhibited considerable variability
due to economic conditions and market volatility. This resulted in a
significant variation in assumed prepayment rates and discount rates.
The range in the key assumptions for retained interests in Securities and
Banking is due to the different characteristics of the interests retained by the
Company. The interests retained by Securities and Banking range from
highly rated and/or senior in the capital structure to unrated and/or residual
interests.
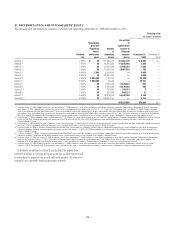
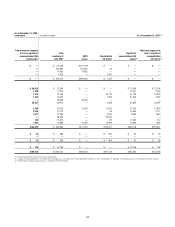
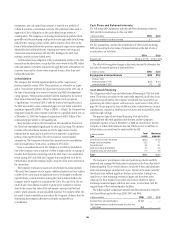
The effect of two negative changes in each of the key assumptions used to
determine the fair value of retained interests is required to be disclosed. The
negative effect of each change must be calculated independently, holding all
other assumptions constant. Because the key assumptions may not in fact be
independent, the net effect of simultaneous adverse changes in the key
assumptions may be less than the sum of the individual effects shown below.
At December 31, 2008, the key assumptions used to value retained
interests and the sensitivity of the fair value to adverse changes of 10% and
20% in each of the key assumptions were as follows:
2008
U.S.
Consumer
mortgages
Securities
and Banking
mortgages
Discount rate 7.8% 5.1% to 39.4%
Constant prepayment rate 30.6% 2.0% to 18.2%
Anticipated net credit losses 0.1% 40.0% to 85%
In millions of dollars
U.S.
Consumer
mortgages
Securities and
Banking
mortgages
Carrying value of retained interests $ 7,571 $ 956
Discount rates
Adverse change of 10% $ (149) $ (45)
Adverse change of 20% (290) (90)
Constant prepayment rate
Adverse change of 10% $ (480) $ (9)
Adverse change of 20% (910) (18)
Anticipated net credit losses
Adverse change of 10% $ (26) $ (62)
Adverse change of 20% (49) (113)
181