Citibank 2008 Annual Report Download - page 144
Download and view the complete annual report
Please find page 144 of the 2008 Citibank annual report below. You can navigate through the pages in the report by either clicking on the pages listed below, or by using the keyword search tool below to find specific information within the annual report.-
 1
1 -
2
-
3
-
4
-
5
-
6
-
7
-
8
-
9
-
10
-
11
-
12
-
13
-
14
-
15
-
16
-
17
-
18
-
19
-
20
-
21
-
22
-
23
-
24
-
25
-
26
-
27
-
28
-
29
-
30
-
31
-
32
-
33
-
34
-
35
-
36
-
37
-
38
-
39
-
40
-
41
-
42
-
43
-
44
-
45
-
46
-
47
-
48
-
49
-
50
-
51
-
52
-
53
-
54
-
55
-
56
-
57
-
58
-
59
-
60
-
61
-
62
-
63
-
64
-
65
-
66
-
67
-
68
-
69
-
70
-
71
-
72
-
73
-
74
-
75
-
76
-
77
-
78
-
79
-
80
-
81
-
82
-
83
-
84
-
85
-
86
-
87
-
88
-
89
-
90
-
91
-
92
-
93
-
94
-
95
-
96
-
97
-
98
-
99
-
100
-
101
-
102
-
103
-
104
-
105
-
106
-
107
-
108
-
109
-
110
-
111
-
112
-
113
-
114
-
115
-
116
-
117
-
118
-
119
-
120
-
121
-
122
-
123
-
124
-
125
-
126
-
127
-
128
-
129
-
130
-
131
-
132
-
133
-
 134
134 -
 135
135 -
 136
136 -
 137
137 -
 138
138 -
 139
139 -
 140
140 -
 141
141 -
 142
142 -
 143
143 -
 144
144 -
 145
145 -
 146
146 -
 147
147 -
 148
148 -
 149
149 -
 150
150 -
 151
151 -
 152
152 -
 153
153 -
 154
154 -
155
-
156
-
157
-
158
-
159
-
160
-
161
-
162
-
163
-
164
-
165
-
166
-
167
-
168
-
169
-
170
-
171
-
172
-
173
-
174
-
175
-
176
-
177
-
178
-
179
-
180
-
181
-
182
-
183
-
184
-
185
-
186
-
187
-
188
-
189
-
190
-
191
-
192
-
193
-
194
-
195
-
196
-
197
-
198
-
199
-
200
-
201
-
202
-
203
-
204
-
205
-
206
-
207
-
208
-
209
-
210
-
211
-
212
-
213
-
214
-
215
-
216
-
217
-
218
-
219
-
220
-
221
-
222
-
223
-
224
-
225
-
226
-
227
-
228
-
229
-
230
-
231
-
232
-
233
-
234
-
235
-
236
-
237
-
238
-
239
-
240
-
241
-
242
-
243
-
244
-
245
-
246
-
247
-
248
-
249
-
250
-
251
-
252
 |
 |

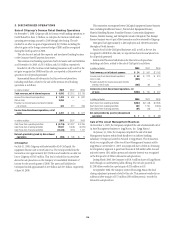
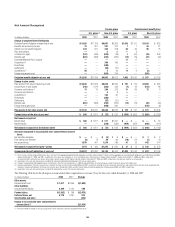
4. BUSINESS SEGMENTS
Citigroup is a diversified bank holding company whose businesses provide a
broad range of financial services to consumer and corporate customers
around the world. The Company’s activities are conducted through the
Global Cards,Consumer Banking,Institutional Clients Group (ICG),
Global Wealth Management (GWM) and Corporate/Other business
segments.
The Global Cards segment is a global issuer of credit cards through the
MasterCard, Visa, Diners Club, Private Label and American Express
platforms. The Consumer Banking segment includes a global, full-service
consumer franchise delivering a wide array of banking, lending, insurance
and investment services through a network of local branches, offices and
electronic delivery systems.
The businesses included in the Company’s ICG segment provide
corporations, governments, institutions and investors in approximately 100
countries with a broad range of banking and financial products and services.
The Global Wealth Management segment is composed of the Smith
Barney Private Client businesses and Citigroup Private Bank. Smith Barney
provides investment advice, financial planning and brokerage services to
affluent individuals, companies and non-profits. Private Bank provides
personalized wealth management services for high-net-worth clients.
Corporate/Other includes net treasury results, unallocated corporate
expenses, offsets to certain line-item reclassifications (eliminations), the
results of discontinued operations and unallocated taxes.
The accounting policies of these reportable segments are the same as
those disclosed in Note 1 to the Consolidated Financial Statements on
page 122
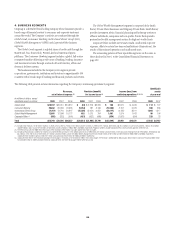
The following table presents certain information regarding the Company’s continuing operations by segment:
Revenues,
net of interest expense (1)
Provision (benefit)
for income taxes (2)
Income (loss) from
continuing operations (1) (2) (3)
Identifiable
assets
at year end
In millions of dollars, except
identifiable assets in billions 2008 2007 2006 2008 2007 2006 2008 2007 2006 2008 2007
Global Cards $20,207 $23,051 $19,812 $ (84) $ 2,278 $2,355 $ 166 $4,674 $ 4,978 $ 114 $ 127
Consumer Banking 28,652 29,458 26,635 (5,354) 181 2,136 (12,280) 2,157 6,073 496 563
Institutional Clients Group (7,817) 13,740 30,647 (15,405) (5,054) 3,052 (20,117) (4,155) 8,611 1,003 1,317
Global Wealth Management 12,601 12,998 10,177 652 1,019 704 1,091 1,974 1,443 99 104
Corporate/Other (4) (850) (752) (944) (421) (922) (498) (954) (1,661) (654) 226 76
Total $52,793 $78,495 $86,327 $(20,612) $(2,498) $7,749 $(32,094) $2,989 $20,451 $1,938 $2,187
(1) Includes total revenues, net of interest expense, in North America of $13.7 billion, $37.6 billion and $51.3 billion; in EMEA of $11.1 billion, $9.2 billion and $12.4 billion; in Latin America of $13.1 billion, $13.6 billion
and $9.9 billion; and in Asia of $15.6 billion, $18.8 billion and $13.8 billion in 2008, 2007 and 2006, respectively. Regional numbers exclude Corporate/Other, which primarily operates within the U.S.
(2) The effective tax rates for 2006 reflect the impact of the resolution of the Federal Tax Audit and the New York Tax Audits.
(3) Includes pretax provisions (credits) for credit losses and for benefits and claims in the Global Cards results of $9.6 billion, $5.5 billion and $3.2 billion; in the Consumer Banking results of $19.6 billion, $10.8 billion and
$3.8 billion; in the ICG results of $5.2 billion, $1.5 billion and $532 million; and in the Global Wealth Management results of $301 million, $101 million and $24 million for 2008, 2007 and 2006, respectively.
Corporate/Other recorded a pretax credit of $1 million and a provision of $(2) million for 2008 and 2007, respectively.
(4) Corporate/Other reflects the restructuring charge, net of changes in estimates, of $1.8 billion for 2007. Of this total charge, $119 million is attributable to Global Cards; $382 million to Consumer Banking; $608 million
to ICG; $305 million to GWM; and $383 million to Corporate/Other. See Note 10 on page 150 for further discussion.
138