Citibank 2008 Annual Report Download - page 153
Download and view the complete annual report
Please find page 153 of the 2008 Citibank annual report below. You can navigate through the pages in the report by either clicking on the pages listed below, or by using the keyword search tool below to find specific information within the annual report.-
 1
1 -
2
-
3
-
4
-
5
-
6
-
7
-
8
-
9
-
10
-
11
-
12
-
13
-
14
-
15
-
16
-
17
-
18
-
19
-
20
-
21
-
22
-
23
-
24
-
25
-
26
-
27
-
28
-
29
-
30
-
31
-
32
-
33
-
34
-
35
-
36
-
37
-
38
-
39
-
40
-
41
-
42
-
43
-
44
-
45
-
46
-
47
-
48
-
49
-
50
-
51
-
52
-
53
-
54
-
55
-
56
-
57
-
58
-
59
-
60
-
61
-
62
-
63
-
64
-
65
-
66
-
67
-
68
-
69
-
70
-
71
-
72
-
73
-
74
-
75
-
76
-
77
-
78
-
79
-
80
-
81
-
82
-
83
-
84
-
85
-
86
-
87
-
88
-
89
-
90
-
91
-
92
-
93
-
94
-
95
-
96
-
97
-
98
-
99
-
100
-
101
-
102
-
103
-
104
-
105
-
106
-
107
-
108
-
109
-
110
-
111
-
112
-
113
-
114
-
115
-
116
-
117
-
118
-
119
-
120
-
121
-
122
-
123
-
124
-
125
-
126
-
127
-
128
-
129
-
130
-
131
-
132
-
133
-
134
-
135
-
136
-
137
-
138
-
139
-
140
-
141
-
142
-
 143
143 -
 144
144 -
 145
145 -
 146
146 -
 147
147 -
 148
148 -
 149
149 -
 150
150 -
 151
151 -
 152
152 -
 153
153 -
 154
154 -
 155
155 -
 156
156 -
 157
157 -
 158
158 -
 159
159 -
 160
160 -
 161
161 -
 162
162 -
 163
163 -
164
-
165
-
166
-
167
-
168
-
169
-
170
-
171
-
172
-
173
-
174
-
175
-
176
-
177
-
178
-
179
-
180
-
181
-
182
-
183
-
184
-
185
-
186
-
187
-
188
-
189
-
190
-
191
-
192
-
193
-
194
-
195
-
196
-
197
-
198
-
199
-
200
-
201
-
202
-
203
-
204
-
205
-
206
-
207
-
208
-
209
-
210
-
211
-
212
-
213
-
214
-
215
-
216
-
217
-
218
-
219
-
220
-
221
-
222
-
223
-
224
-
225
-
226
-
227
-
228
-
229
-
230
-
231
-
232
-
233
-
234
-
235
-
236
-
237
-
238
-
239
-
240
-
241
-
242
-
243
-
244
-
245
-
246
-
247
-
248
-
249
-
250
-
251
-
252
 |
 |

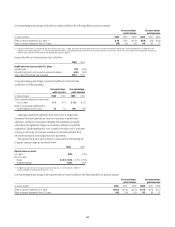
A one-percentage-point change in the discount rates would have the following effects on pension expense:
One-percentage-
point increase
One-percentage-
point decrease
In millions of dollars 2008 2007 2006 2008 2007 2006
Effect on pension expense for U.S. plans (1) $36 $ 25 $(100) $(24) $ (5) $120
Effect on pension expense for non-U.S. plans (58) (59) (52) 94 80 72
(1) Due to the freeze of the U.S. qualified pension plan commencing January 1, 2008, the majority of the prospective service cost has been eliminated and the gain/loss amortization period was changed to the life
expectancy for inactive participants. As a result, pension expense for the U.S. qualified pension plan is driven more by interest costs than service costs, and an increase in the discount rate would increase pension
expense, while a decrease in the discount rate would decrease pension expense.
Assumed health care cost trend rates were as follows:
2008 2007
Health care cost increase rate–U.S. plans
Following year 7.5% 8.0%
Ultimate rate to which cost increase is assumed to decline 5.0% 5.0%
Year in which the ultimate rate is reached 2014 2014
A one-percentage-point change in assumed health care cost trend rates
would have the following effects:
One-percentage-
point increase
One-percentage-
point decrease
In millions of dollars 2008 2007 2008 2007
Effect on benefits earned and interest cost
for U.S. plans $3 $3 $ (2) $ (3)
Effect on accumulated postretirement
benefit obligation for U.S. plans 47 50 (41) (44)
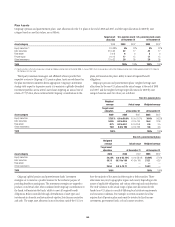
Citigroup considers the expected rate of return to be a longer-term
assessment of return expectations, based on each plan’s expected asset
allocation, and does not anticipate changing this assumption annually
unless there are significant changes in economic conditions or portfolio
composition. Market performance over a number of earlier years is evaluated
covering a wide range of economic conditions to determine whether there
are sound reasons for projecting forward any past trends.
The expected long-term rates of return on assets used in determining the
Company’s pension expense are shown below:
2008 2007
Rate of return on assets
U.S. plans (1) 8.0% 8.0%
Non-U.S. plans
Range 3.14 to 12.5% 3.25 to 12.5%
Weighted average 7.62% 8.0%
(1) Weighted average rates for the U.S. plans equal the stated rates. As of December 31, 2008, the
Company lowered its expected rate of return to 7.75%.
A one-percentage-point change in the expected rates of return would have the following effects on pension expense:
One-percentage-
point increase
One-percentage-
point decrease
In millions of dollars 2008 2007 2006 2008 2007 2006
Effect on pension expense for U.S. plans $(118) $(118) $(110) $118 $118 $110
Effect on pension expense for non-U.S. plans (66) (59) (61) 66 59 61
147