Citibank 2008 Annual Report Download - page 228
Download and view the complete annual report
Please find page 228 of the 2008 Citibank annual report below. You can navigate through the pages in the report by either clicking on the pages listed below, or by using the keyword search tool below to find specific information within the annual report.-
 1
1 -
2
-
3
-
4
-
5
-
6
-
7
-
8
-
9
-
10
-
11
-
12
-
13
-
14
-
15
-
16
-
17
-
18
-
19
-
20
-
21
-
22
-
23
-
24
-
25
-
26
-
27
-
28
-
29
-
30
-
31
-
32
-
33
-
34
-
35
-
36
-
37
-
38
-
39
-
40
-
41
-
42
-
43
-
44
-
45
-
46
-
47
-
48
-
49
-
50
-
51
-
52
-
53
-
54
-
55
-
56
-
57
-
58
-
59
-
60
-
61
-
62
-
63
-
64
-
65
-
66
-
67
-
68
-
69
-
70
-
71
-
72
-
73
-
74
-
75
-
76
-
77
-
78
-
79
-
80
-
81
-
82
-
83
-
84
-
85
-
86
-
87
-
88
-
89
-
90
-
91
-
92
-
93
-
94
-
95
-
96
-
97
-
98
-
99
-
100
-
101
-
102
-
103
-
104
-
105
-
106
-
107
-
108
-
109
-
110
-
111
-
112
-
113
-
114
-
115
-
116
-
117
-
118
-
119
-
120
-
121
-
122
-
123
-
124
-
125
-
126
-
127
-
128
-
129
-
130
-
131
-
132
-
133
-
134
-
135
-
136
-
137
-
138
-
139
-
140
-
141
-
142
-
143
-
144
-
145
-
146
-
147
-
148
-
149
-
150
-
151
-
152
-
153
-
154
-
155
-
156
-
157
-
158
-
159
-
160
-
161
-
162
-
163
-
164
-
165
-
166
-
167
-
168
-
169
-
170
-
171
-
172
-
173
-
174
-
175
-
176
-
177
-
178
-
179
-
180
-
181
-
182
-
183
-
184
-
185
-
186
-
187
-
188
-
189
-
190
-
191
-
192
-
193
-
194
-
195
-
196
-
197
-
198
-
199
-
200
-
201
-
202
-
203
-
204
-
205
-
206
-
207
-
208
-
209
-
210
-
211
-
212
-
213
-
214
-
215
-
216
-
217
-
 218
218 -
 219
219 -
 220
220 -
 221
221 -
 222
222 -
 223
223 -
 224
224 -
 225
225 -
 226
226 -
 227
227 -
 228
228 -
 229
229 -
 230
230 -
 231
231 -
 232
232 -
 233
233 -
 234
234 -
 235
235 -
 236
236 -
 237
237 -
 238
238 -
239
-
240
-
241
-
242
-
243
-
244
-
245
-
246
-
247
-
248
-
249
-
250
-
251
-
252
 |
 |

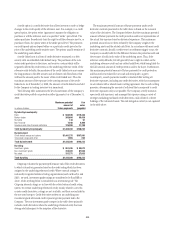
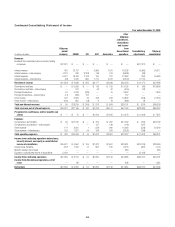
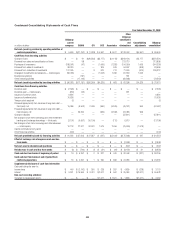
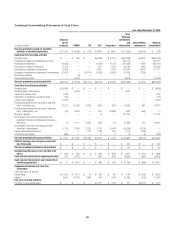
Condensed Consolidating Statements of Cash Flows
Year Ended December 31, 2008
In millions of dollars
Citigroup
parent
company CGMHI CFI CCC Associates
Other
Citigroup
subsidiaries
and
eliminations
Consolidating
adjustments
Citigroup
consolidated
Net cash (used in) provided by operating activities of
continuing operations $ 5,600 $(21,162) $ (1,028) $ 4,591 $ 4,677 $ 108,453 $(4,591) $ 96,540
Cash flows from investing activities
Change in loans $ — $ 91 $(26,363) $(3,177) $(1,118) $(243,131) $ 3,177 $(270,521)
Proceeds from sales and securitizations of loans — 98 — — — 313,710 — 313,808
Purchases of investments (188,901) (47) — (1,065) (1,338) (154,050) 1,065 (344,336)
Proceeds from sales of investments 38,020 — — 309 649 54,997 (309) 93,666
Proceeds from maturities of investments 137,005 — 3 670 774 71,530 (670) 209,312
Changes in investments and advances — intercompany (83,055) — — (1,062) 1,496 81,559 1,062 —
Business acquisitions — (181) — — — 181 — —
Other investing activities — (17,142) — — — (62,398) — (79,540)
Net cash (used in) provided by investing activities $ (96,931) $(17,181) $(26,360) $(4,325) $ 463 $ 62,398 $ 4,325 $ (77,611)
Cash flows from financing activities
Dividends paid $ (7,526) $ — $ — $ — $ — $ — $ — $ (7,526)
Dividends paid — intercompany (239) (92) — — — 331 — —
Issuance of common stock 6,864 — — — — — — 6,864
Issuance of preferred stock 70,626 — — — — — — 70,626
Treasury stock acquired (7) — — — — — — (7)
Proceeds/(repayments) from issuance of long-term debt —
third-party, net 15,086 (9,543) 2,496 (960) (5,345) (45,181) 960 (42,487)
Proceeds/(repayments) from issuance of long-term debt —
intercompany, net — 26,264 — (956) (2,183) (24,081) 956 —
Change in deposits — — — — — (37,811) — (37,811)
Net change in short-term borrowings and other investment
banking and brokerage borrowings — third-party (3,197) (6,997) (10,100) — (112) 6,610 — (13,796)
Net change in short-term borrowings and other advances
— intercompany 10,118 27,971 34,991 1,619 2,456 (75,536) (1,619) —
Capital contributions from parent — — — — — — — —
Other financing activities (400) — — — — — — (400)
Net cash provided by (used in) financing activities $ 91,325 $ 37,603 $ 27,387 $ (297) $(5,184) $(175,668) $ 297 $ (24,537)
Effect of exchange rate changes on cash and due
from banks $ — $ — $ — $ — $ — $ (2,948) $ — $ (2,948)
Net cash used in discontinued operations $ — $ — $ — $ — $ — $ (397) $ — $ (397)
Net decrease in cash and due from banks $ (6) $ (740) $ (1) $ (31) $ (44) $ (8,162) $ 31 $ (8,953)
Cash and due from banks at beginning of period $ 19 $ 5,297 $ 2 $ 321 $ 440 $ 32,448 $ (321) $ 38,206
Cash and due from banks at end of period from
continuing operations $ 13 $ 4,557 $ 1 $ 290 $ 396 $ 24,286 $ (290) $ 29,253
Supplemental disclosure of cash flow information
Cash paid during the year for:
Income taxes $ 440 $ (2,742) $ 350 $ 228 $ 287 $ 4,835 $ (228) $ 3,170
Interest $ 9,341 $ 16,990 $ 3,761 $ 2,677 $ 502 $ 25,084 $(2,677) $ 55,678
Non-cash investing activities:
Transfers to repossessed assets $ — $ — $ — $ 1,571 $ 1,621 $ 1,818 $(1,571) $ 3,439
222