Citibank 2008 Annual Report Download - page 47
Download and view the complete annual report
Please find page 47 of the 2008 Citibank annual report below. You can navigate through the pages in the report by either clicking on the pages listed below, or by using the keyword search tool below to find specific information within the annual report.-
 1
1 -
2
-
3
-
4
-
5
-
6
-
7
-
8
-
9
-
10
-
11
-
12
-
13
-
14
-
15
-
16
-
17
-
18
-
19
-
20
-
21
-
22
-
23
-
24
-
25
-
26
-
27
-
28
-
29
-
30
-
31
-
32
-
33
-
34
-
35
-
36
-
 37
37 -
 38
38 -
 39
39 -
 40
40 -
 41
41 -
 42
42 -
 43
43 -
 44
44 -
 45
45 -
 46
46 -
 47
47 -
 48
48 -
 49
49 -
 50
50 -
 51
51 -
 52
52 -
 53
53 -
 54
54 -
 55
55 -
 56
56 -
 57
57 -
58
-
59
-
60
-
61
-
62
-
63
-
64
-
65
-
66
-
67
-
68
-
69
-
70
-
71
-
72
-
73
-
74
-
75
-
76
-
77
-
78
-
79
-
80
-
81
-
82
-
83
-
84
-
85
-
86
-
87
-
88
-
89
-
90
-
91
-
92
-
93
-
94
-
95
-
96
-
97
-
98
-
99
-
100
-
101
-
102
-
103
-
104
-
105
-
106
-
107
-
108
-
109
-
110
-
111
-
112
-
113
-
114
-
115
-
116
-
117
-
118
-
119
-
120
-
121
-
122
-
123
-
124
-
125
-
126
-
127
-
128
-
129
-
130
-
131
-
132
-
133
-
134
-
135
-
136
-
137
-
138
-
139
-
140
-
141
-
142
-
143
-
144
-
145
-
146
-
147
-
148
-
149
-
150
-
151
-
152
-
153
-
154
-
155
-
156
-
157
-
158
-
159
-
160
-
161
-
162
-
163
-
164
-
165
-
166
-
167
-
168
-
169
-
170
-
171
-
172
-
173
-
174
-
175
-
176
-
177
-
178
-
179
-
180
-
181
-
182
-
183
-
184
-
185
-
186
-
187
-
188
-
189
-
190
-
191
-
192
-
193
-
194
-
195
-
196
-
197
-
198
-
199
-
200
-
201
-
202
-
203
-
204
-
205
-
206
-
207
-
208
-
209
-
210
-
211
-
212
-
213
-
214
-
215
-
216
-
217
-
218
-
219
-
220
-
221
-
222
-
223
-
224
-
225
-
226
-
227
-
228
-
229
-
230
-
231
-
232
-
233
-
234
-
235
-
236
-
237
-
238
-
239
-
240
-
241
-
242
-
243
-
244
-
245
-
246
-
247
-
248
-
249
-
250
-
251
-
252
 |
 |

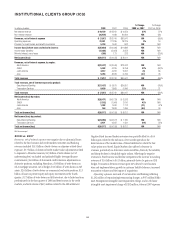
LATIN AMERICA
In millions of dollars 2008 2007 2006
% Change
2008 vs. 2007
% Change
2007 vs. 2006
Net interest revenue $ 8,001 $ 7,151 $5,053 12% 42%
Non-interest revenue 5,144 6,416 4,822 (20) 33
Revenues, net of interest expense $13,145 $13,567 $9,875 (3)% 37%
Operating expenses 11,103 6,777 5,513 64 23
Provisions for loan losses and for benefits and claims 3,670 1,867 1,043 97 79
Income before taxes and minority interest $ (1,628) $ 4,923 $3,319 NM 48%
Income taxes 351 1,326 503 (74)% NM
Minority interest, net of taxes 421 100 100
Net income (loss) $ (1,983) $ 3,595 $2,815 NM 28%
Average assets (in billions of dollars) $ 153 $ 145 $ 116 6% 25%
Return on assets (1.30)% 2.48% 2.43%
Key indicators (in billions of dollars, except in branches)
Average loans $ 59.0 $ 55.5 $ 40.8 6% 36%
Average Consumer Banking loans 15.1 13.2 10.3 14 28
Average deposits (and other consumer liability balances) 67.0 62.2 49.3 826
Branches/offices 2,571 2,747 2,404 (6) 14
NM Not meaningful.
2008 vs. 2007
Revenues,net of interest expense were 3% lower than the prior year, as
growth of 6% in average loans and 8% in total customer deposits was more
than offset by FX translation. Global Cards grew 4% on higher volumes and
a $661 million gain on Redecard shares. Consumer Banking decreased 5%
mainly due to FX translation and the divestiture of the Chile consumer
banking operation in January 2008. S&B revenue decreased 22% due to
write-downs and losses related to fixed income and equities. Transaction
Services revenues increased 24%, mainly from the custody business as
average deposits grew rapidly in the second half of 2007 and have remained
at those levels.
Operating expenses growth of 64% was primarily driven by a $4.258
billion goodwill impairment charge, acquisitions and volume growth,
higher collection costs, legal costs and reserves, and repositioning charges,
partially offset by a $282 million benefit related to a legal vehicle
repositioning in Mexico in the first quarter of 2008. Certain poorly
performing branches were closed, mainly in Brazil and Mexico, partially
offset by openings in Mexico, due to repositioning and realignment in both
retail and consumer finance.
Provisions for loan losses and for benefits and claims increased 97%
as the credit environment, mainly in Mexico, Brazil and Colombia,
worsened, primarily reflected by a $1.2 billion increase in net credit losses
and an increase in loan loss reserve builds.
2007 vs. 2006
Revenues, net of interest expense were 37% higher than the prior year,
associated with higher volumes, the Cuscatlan and GFU acquisitions, the
integration of CrediCard in Brazil, as well as gains on non-core assets
including a $729 million pretax gain on Redecard shares, a $235 million
pretax gain on Visa shares and a pretax gain of $78 million from the
MasterCard initial public offering. These gains were partially offset by the
gain on sale of Avantel of $234 million in 2006.
Operating expenses growth of 23% was primarily driven by the
Cuscatlan and GFU acquisitions and the Brazil expansion strategy.
Provisions for loan losses and for benefits and claims increased 79%
primarily reflecting market conditions and portfolio growth (mainly Global
Cards), as well as the impact of acquisitions.
41