Citibank 2008 Annual Report Download - page 165
Download and view the complete annual report
Please find page 165 of the 2008 Citibank annual report below. You can navigate through the pages in the report by either clicking on the pages listed below, or by using the keyword search tool below to find specific information within the annual report.-
 1
1 -
2
-
3
-
4
-
5
-
6
-
7
-
8
-
9
-
10
-
11
-
12
-
13
-
14
-
15
-
16
-
17
-
18
-
19
-
20
-
21
-
22
-
23
-
24
-
25
-
26
-
27
-
28
-
29
-
30
-
31
-
32
-
33
-
34
-
35
-
36
-
37
-
38
-
39
-
40
-
41
-
42
-
43
-
44
-
45
-
46
-
47
-
48
-
49
-
50
-
51
-
52
-
53
-
54
-
55
-
56
-
57
-
58
-
59
-
60
-
61
-
62
-
63
-
64
-
65
-
66
-
67
-
68
-
69
-
70
-
71
-
72
-
73
-
74
-
75
-
76
-
77
-
78
-
79
-
80
-
81
-
82
-
83
-
84
-
85
-
86
-
87
-
88
-
89
-
90
-
91
-
92
-
93
-
94
-
95
-
96
-
97
-
98
-
99
-
100
-
101
-
102
-
103
-
104
-
105
-
106
-
107
-
108
-
109
-
110
-
111
-
112
-
113
-
114
-
115
-
116
-
117
-
118
-
119
-
120
-
121
-
122
-
123
-
124
-
125
-
126
-
127
-
128
-
129
-
130
-
131
-
132
-
133
-
134
-
135
-
136
-
137
-
138
-
139
-
140
-
141
-
142
-
143
-
144
-
145
-
146
-
147
-
148
-
149
-
150
-
151
-
152
-
153
-
154
-
 155
155 -
 156
156 -
 157
157 -
 158
158 -
 159
159 -
 160
160 -
 161
161 -
 162
162 -
 163
163 -
 164
164 -
 165
165 -
 166
166 -
 167
167 -
 168
168 -
 169
169 -
 170
170 -
 171
171 -
 172
172 -
 173
173 -
 174
174 -
 175
175 -
176
-
177
-
178
-
179
-
180
-
181
-
182
-
183
-
184
-
185
-
186
-
187
-
188
-
189
-
190
-
191
-
192
-
193
-
194
-
195
-
196
-
197
-
198
-
199
-
200
-
201
-
202
-
203
-
204
-
205
-
206
-
207
-
208
-
209
-
210
-
211
-
212
-
213
-
214
-
215
-
216
-
217
-
218
-
219
-
220
-
221
-
222
-
223
-
224
-
225
-
226
-
227
-
228
-
229
-
230
-
231
-
232
-
233
-
234
-
235
-
236
-
237
-
238
-
239
-
240
-
241
-
242
-
243
-
244
-
245
-
246
-
247
-
248
-
249
-
250
-
251
-
252
 |
 |

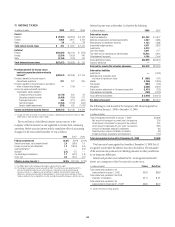
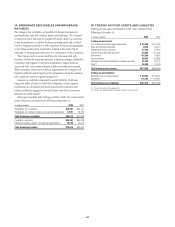
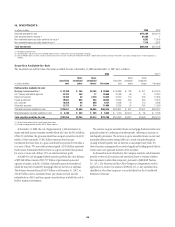
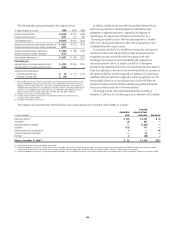
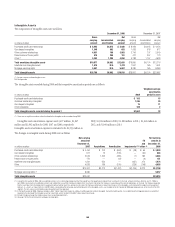
The table below shows the fair value of investments in available-for-sale securities that have been in an unrealized loss position for less than 12 months or
for 12 months or longer as of December 31, 2008 and 2007:
Less than 12 months 12 months or longer Total
In millions of dollars at year end
Fair
value
Gross
unrealized
losses
Fair
value
Gross
unrealized
losses
Fair
value
Gross
unrealized
losses
2008:
Securities available-for-sale
Mortgage-backed securities $ 7,800 $1,177 $ 3,793 $2,019 $ 11,593 $3,196
U.S. Treasury and federal agencies 1,654 76 1 1 1,655 77
State and municipal 12,827 3,872 3,762 498 16,589 4,370
Foreign government 10,697 201 9,080 207 19,777 408
U.S. corporate 1,604 214 3,872 376 5,476 590
Other debt securities 1,325 152 824 162 2,149 314
Marketable equity securities available-for-sale 3,254 386 102 73 3,356 459
Total securities available-for-sale $39,161 $6,078 $21,434 $3,336 $ 60,595 $9,414
2007:
Securities available-for-sale
Mortgage-backed securities $ 4,432 $ 65 $27,221 $ 906 $ 31,653 $ 971
U.S. Treasury and federal agencies 7,369 28 4,431 42 11,800 70
State and municipal 7,944 190 1,079 66 9,023 256
Foreign government 34,929 305 9,598 355 44,527 660
U.S. corporate 1,489 52 1,789 418 3,278 470
Other debt securities 3,214 49 879 65 4,093 114
Marketable equity securities available-for-sale 60 12 39 46 99 58
Total securities available-for-sale $59,437 $ 701 $45,036 $1,898 $104,473 $2,599
159