Citibank 2008 Annual Report Download - page 89
Download and view the complete annual report
Please find page 89 of the 2008 Citibank annual report below. You can navigate through the pages in the report by either clicking on the pages listed below, or by using the keyword search tool below to find specific information within the annual report.-
 1
1 -
2
-
3
-
4
-
5
-
6
-
7
-
8
-
9
-
10
-
11
-
12
-
13
-
14
-
15
-
16
-
17
-
18
-
19
-
20
-
21
-
22
-
23
-
24
-
25
-
26
-
27
-
28
-
29
-
30
-
31
-
32
-
33
-
34
-
35
-
36
-
37
-
38
-
39
-
40
-
41
-
42
-
43
-
44
-
45
-
46
-
47
-
48
-
49
-
50
-
51
-
52
-
53
-
54
-
55
-
56
-
57
-
58
-
59
-
60
-
61
-
62
-
63
-
64
-
65
-
66
-
67
-
68
-
69
-
70
-
71
-
72
-
73
-
74
-
75
-
76
-
77
-
78
-
 79
79 -
 80
80 -
 81
81 -
 82
82 -
 83
83 -
 84
84 -
 85
85 -
 86
86 -
 87
87 -
 88
88 -
 89
89 -
 90
90 -
 91
91 -
 92
92 -
 93
93 -
 94
94 -
 95
95 -
 96
96 -
 97
97 -
 98
98 -
 99
99 -
100
-
101
-
102
-
103
-
104
-
105
-
106
-
107
-
108
-
109
-
110
-
111
-
112
-
113
-
114
-
115
-
116
-
117
-
118
-
119
-
120
-
121
-
122
-
123
-
124
-
125
-
126
-
127
-
128
-
129
-
130
-
131
-
132
-
133
-
134
-
135
-
136
-
137
-
138
-
139
-
140
-
141
-
142
-
143
-
144
-
145
-
146
-
147
-
148
-
149
-
150
-
151
-
152
-
153
-
154
-
155
-
156
-
157
-
158
-
159
-
160
-
161
-
162
-
163
-
164
-
165
-
166
-
167
-
168
-
169
-
170
-
171
-
172
-
173
-
174
-
175
-
176
-
177
-
178
-
179
-
180
-
181
-
182
-
183
-
184
-
185
-
186
-
187
-
188
-
189
-
190
-
191
-
192
-
193
-
194
-
195
-
196
-
197
-
198
-
199
-
200
-
201
-
202
-
203
-
204
-
205
-
206
-
207
-
208
-
209
-
210
-
211
-
212
-
213
-
214
-
215
-
216
-
217
-
218
-
219
-
220
-
221
-
222
-
223
-
224
-
225
-
226
-
227
-
228
-
229
-
230
-
231
-
232
-
233
-
234
-
235
-
236
-
237
-
238
-
239
-
240
-
241
-
242
-
243
-
244
-
245
-
246
-
247
-
248
-
249
-
250
-
251
-
252
 |
 |

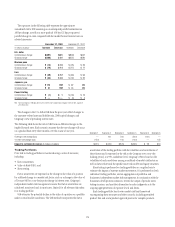
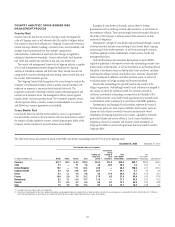
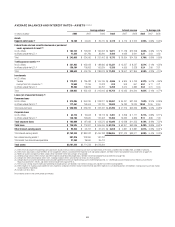
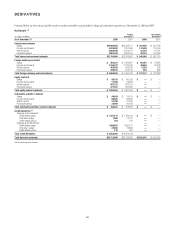
AVERAGE BALANCES AND INTEREST RATES—ASSETS (1)(2)(3)(4)
Average volume Interest revenue % Average rate
In millions of dollars 2008 2007 2006 2008 2007 2006 2008 2007 2006
Assets
Deposits with banks (5) $ 78,788 $ 54,840 $ 35,770 $ 3,119 $ 3,113 $ 2,240 3.96% 5.68% 6.26%
Federal funds sold and securities borrowed or purchased
under agreements to resell (6)
In U.S. offices $ 164,732 $ 192,824 $ 166,202 $ 5,071 $ 11,728 $10,258 3.08% 6.08% 6.17%
In offices outside the U.S. (5) 77,324 131,766 85,200 4,104 6,626 3,941 5.31 5.03 4.63
Total $ 242,056 $ 324,590 $ 251,402 $ 9,175 $ 18,354 $14,199 3.79% 5.65% 5.65%
Trading account assets (7) (8)
In U.S. offices $ 221,455 $ 263,922 $ 188,985 $ 12,331 $ 13,557 $ 8,537 5.57% 5.14% 4.52%
In offices outside the U.S. (5) 159,194 176,803 100,634 5,158 4,950 3,328 3.24 2.80 3.31
Total $ 380,649 $ 440,725 $ 289,619 $ 17,489 $ 18,507 $11,865 4.59% 4.20% 4.10%
Investments
In U.S. offices
Taxable $ 112,071 $ 136,482 $ 106,136 $ 4,846 $ 6,840 $ 4,799 4.32% 5.01% 4.52%
Exempt from U.S. income tax (1) 13,584 17,796 14,023 613 909 661 4.51 5.11 4.71
In offices outside the U.S. (5) 95,308 108,875 96,757 5,259 5,674 4,880 5.52 5.21 5.04
Total $ 220,963 $ 263,153 $ 216,916 $ 10,718 $ 13,423 $10,340 4.85% 5.10% 4.77%
Loans (net of unearned income) (9)
Consumer loans
In U.S. offices $ 373,095 $ 364,220 $ 328,311 $ 28,657 $ 30,491 $27,499 7.68% 8.37% 8.38%
In offices outside the U.S. (5) 177,461 159,004 124,120 18,633 16,782 13,034 10.50 10.55 10.50
Total consumer loans $ 550,556 $ 523,224 $ 452,431 $ 47,290 $ 47,273 $40,533 8.59% 9.03% 8.96%
Corporate loans
In U.S. offices $ 43,773 $ 34,843 $ 28,113 $ 2,281 $ 2,398 $ 1,717 5.21% 6.88% 6.11%
In offices outside the U.S. (5) 140,196 152,840 124,462 12,765 13,530 9,836 9.11 8.85 7.90
Total corporate loans $ 183,969 $ 187,683 $ 152,575 $ 15,046 $ 15,928 $11,553 8.18% 8.49% 7.57%
Total loans $ 734,525 $ 710,907 $ 605,006 $ 62,336 $ 63,201 $52,086 8.49% 8.89% 8.61%
Other interest-earning assets $ 95,253 $ 90,707 $ 57,470 $ 3,818 $ 4,831 $ 2,881 4.01% 5.33% 5.01%
Total interest-earning assets $1,752,234 $1,884,922 $1,456,183 $106,655 $121,429 $93,611 6.09% 6.44% 6.43%
Non-interest-earning assets (7) 387,876 249,960 187,797
Total assets from discontinued operations 27,368 36,650 35,414
Total assets $2,167,478 $2,171,532 $1,679,394
(1) Interest revenue excludes the taxable equivalent adjustments (based on the U.S. federal statutory tax rate of 35%) of $323 million, $125 million, and $98 million for 2008, 2007, and 2006, respectively.
(2) Interest rates and amounts include the effects of risk management activities associated with the respective asset and liability categories. See Note 24 to the Consolidated Financial Statements on page 189.
(3) Monthly or quarterly averages have been used by certain subsidiaries where daily averages are unavailable.
(4) Detailed average volume, interest revenue and interest expense exclude discontinued operations. See Note 3 to the Consolidated Financial Statements on page 136.
(5) Average rates reflect prevailing local interest rates, including inflationary effects and monetary corrections in certain countries.
(6) Average volumes of securities borrowed or purchased under agreements to resell are reported net pursuant to FASB Interpretation No. 41, “Offsetting of Amounts Related to Certain Repurchase and Reverse
Repurchase Agreements” (FIN 41), and interest revenue excludes the impact of FIN 41.
(7) The fair value carrying amounts of derivative and foreign exchange contracts are reported in non-interest-earning assets and other non-interest-bearing liabilities.
(8) Interest expense on Trading account liabilities of ICG is reported as a reduction of interest revenue. Interest revenue and interest expense on cash collateral positions are reported in Trading account assets and Trading
account liabilities, respectively.
(9) Includes cash-basis loans.
Reclassified to conform to the current period’s presentation.
83