Citibank 2008 Annual Report Download - page 96
Download and view the complete annual report
Please find page 96 of the 2008 Citibank annual report below. You can navigate through the pages in the report by either clicking on the pages listed below, or by using the keyword search tool below to find specific information within the annual report.-
 1
1 -
2
-
3
-
4
-
5
-
6
-
7
-
8
-
9
-
10
-
11
-
12
-
13
-
14
-
15
-
16
-
17
-
18
-
19
-
20
-
21
-
22
-
23
-
24
-
25
-
26
-
27
-
28
-
29
-
30
-
31
-
32
-
33
-
34
-
35
-
36
-
37
-
38
-
39
-
40
-
41
-
42
-
43
-
44
-
45
-
46
-
47
-
48
-
49
-
50
-
51
-
52
-
53
-
54
-
55
-
56
-
57
-
58
-
59
-
60
-
61
-
62
-
63
-
64
-
65
-
66
-
67
-
68
-
69
-
70
-
71
-
72
-
73
-
74
-
75
-
76
-
77
-
78
-
79
-
80
-
81
-
82
-
83
-
84
-
85
-
 86
86 -
 87
87 -
 88
88 -
 89
89 -
 90
90 -
 91
91 -
 92
92 -
 93
93 -
 94
94 -
 95
95 -
 96
96 -
 97
97 -
 98
98 -
 99
99 -
 100
100 -
 101
101 -
 102
102 -
 103
103 -
 104
104 -
 105
105 -
 106
106 -
107
-
108
-
109
-
110
-
111
-
112
-
113
-
114
-
115
-
116
-
117
-
118
-
119
-
120
-
121
-
122
-
123
-
124
-
125
-
126
-
127
-
128
-
129
-
130
-
131
-
132
-
133
-
134
-
135
-
136
-
137
-
138
-
139
-
140
-
141
-
142
-
143
-
144
-
145
-
146
-
147
-
148
-
149
-
150
-
151
-
152
-
153
-
154
-
155
-
156
-
157
-
158
-
159
-
160
-
161
-
162
-
163
-
164
-
165
-
166
-
167
-
168
-
169
-
170
-
171
-
172
-
173
-
174
-
175
-
176
-
177
-
178
-
179
-
180
-
181
-
182
-
183
-
184
-
185
-
186
-
187
-
188
-
189
-
190
-
191
-
192
-
193
-
194
-
195
-
196
-
197
-
198
-
199
-
200
-
201
-
202
-
203
-
204
-
205
-
206
-
207
-
208
-
209
-
210
-
211
-
212
-
213
-
214
-
215
-
216
-
217
-
218
-
219
-
220
-
221
-
222
-
223
-
224
-
225
-
226
-
227
-
228
-
229
-
230
-
231
-
232
-
233
-
234
-
235
-
236
-
237
-
238
-
239
-
240
-
241
-
242
-
243
-
244
-
245
-
246
-
247
-
248
-
249
-
250
-
251
-
252
 |
 |

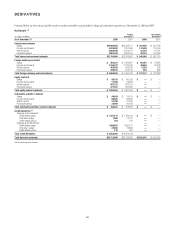
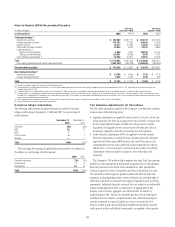
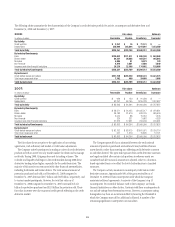
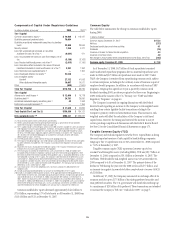
DERIVATIVES
Presented below are the notional and the mark-to-market receivables and payables for Citigroup’s derivative exposures as of December 31, 2008 and 2007:
Notionals (1)
In millions of dollars
Trading
derivatives (2)
Non-trading
derivatives (5)
As of December 31 2008 2007 2008 2007
Interest rate contracts
Swaps $15,096,293 $16,433,117 $ 763,630 $ 521,783
Futures and forwards 2,619,952 1,811,599 118,440 176,146
Written options 2,963,280 3,479,071 25,255 16,741
Purchased options 3,067,443 3,639,075 38,344 167,080
Total interest rate contract notionals $23,746,968 $25,362,862 $ 945,669 $ 881,750
Foreign exchange contracts
Swaps $ 882,327 $ 1,062,267 $ 62,491 $ 75,622
Futures and forwards 2,165,377 2,795,180 40,694 46,732
Written options 483,036 653,535 3,286 292
Purchased options 539,164 644,744 676 686
Total foreign exchange contract notionals $ 4,069,904 $ 5,155,726 $ 107,147 $ 123,332
Equity contracts
Swaps $ 98,315 $ 140,256 $—$—
Futures and forwards 17,390 29,233 ——
Written options 507,327 625,157 ——
Purchased options 471,532 567,030 ——
Total equity contract notionals $ 1,094,564 $ 1,361,676 $—$—
Commodity and other contracts
Swaps $ 44,020 $ 29,415 $—$—
Futures and forwards 60,625 66,860 ——
Written options 31,395 27,087 ——
Purchased options 32,892 30,168 ——
Total commodity and other contract notionals $ 168,932 $ 153,530 $—$—
Credit derivatives (4)
Citigroup as the Guarantor:
Credit default swaps $ 1,441,117 $ 1,755,440 $—$—
Total return swaps 1,905 12,121 ——
Credit default options 258 276 ——
Citigroup as the Beneficiary: —
Credit default swaps 1,560,087 1,890,611 ——
Total return swaps 29,990 15,895 ——
Credit default options 135 450 ——
Total credit derivatives $ 3,033,492 $ 3,674,793
Total derivative notionals $32,113,860 $35,708,587 $1,052,816 $1,005,082
See the following page for footnotes.
90