Citibank 2008 Annual Report Download - page 205
Download and view the complete annual report
Please find page 205 of the 2008 Citibank annual report below. You can navigate through the pages in the report by either clicking on the pages listed below, or by using the keyword search tool below to find specific information within the annual report.-
 1
1 -
2
-
3
-
4
-
5
-
6
-
7
-
8
-
9
-
10
-
11
-
12
-
13
-
14
-
15
-
16
-
17
-
18
-
19
-
20
-
21
-
22
-
23
-
24
-
25
-
26
-
27
-
28
-
29
-
30
-
31
-
32
-
33
-
34
-
35
-
36
-
37
-
38
-
39
-
40
-
41
-
42
-
43
-
44
-
45
-
46
-
47
-
48
-
49
-
50
-
51
-
52
-
53
-
54
-
55
-
56
-
57
-
58
-
59
-
60
-
61
-
62
-
63
-
64
-
65
-
66
-
67
-
68
-
69
-
70
-
71
-
72
-
73
-
74
-
75
-
76
-
77
-
78
-
79
-
80
-
81
-
82
-
83
-
84
-
85
-
86
-
87
-
88
-
89
-
90
-
91
-
92
-
93
-
94
-
95
-
96
-
97
-
98
-
99
-
100
-
101
-
102
-
103
-
104
-
105
-
106
-
107
-
108
-
109
-
110
-
111
-
112
-
113
-
114
-
115
-
116
-
117
-
118
-
119
-
120
-
121
-
122
-
123
-
124
-
125
-
126
-
127
-
128
-
129
-
130
-
131
-
132
-
133
-
134
-
135
-
136
-
137
-
138
-
139
-
140
-
141
-
142
-
143
-
144
-
145
-
146
-
147
-
148
-
149
-
150
-
151
-
152
-
153
-
154
-
155
-
156
-
157
-
158
-
159
-
160
-
161
-
162
-
163
-
164
-
165
-
166
-
167
-
168
-
169
-
170
-
171
-
172
-
173
-
174
-
175
-
176
-
177
-
178
-
179
-
180
-
181
-
182
-
183
-
184
-
185
-
186
-
187
-
188
-
189
-
190
-
191
-
192
-
193
-
194
-
 195
195 -
 196
196 -
 197
197 -
 198
198 -
 199
199 -
 200
200 -
 201
201 -
 202
202 -
 203
203 -
 204
204 -
 205
205 -
 206
206 -
 207
207 -
 208
208 -
 209
209 -
 210
210 -
 211
211 -
 212
212 -
 213
213 -
 214
214 -
 215
215 -
216
-
217
-
218
-
219
-
220
-
221
-
222
-
223
-
224
-
225
-
226
-
227
-
228
-
229
-
230
-
231
-
232
-
233
-
234
-
235
-
236
-
237
-
238
-
239
-
240
-
241
-
242
-
243
-
244
-
245
-
246
-
247
-
248
-
249
-
250
-
251
-
252
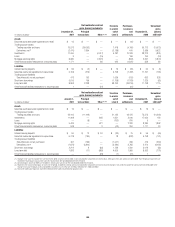
 |
 |

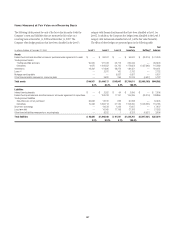
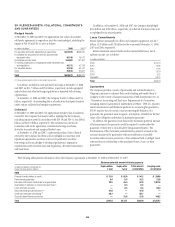
December 31,
2007
Net realized/unrealized
gains (losses) included in Transfers
in and/or
out of
Level 3
Purchases,
issuances
and
settlements
December 31,
2008
Unrealized
gains
(losses)
still held(3)
In millions of dollars
Principal
transactions Other (1) (2)
Assets
Securities purchased under agreements to resell $ 16 $ — $ — $ — $ (16) $ — $ —
Trading account assets
Trading securities and loans 75,573 (28,052) — 7,418 (4,166) 50,773 (19,572)
Derivatives, net (4) (2,470) 7,804 — (2,188) 440 3,586 9,622
Investments 17,060 — (4,917) 5,787 10,343 28,273 (801)
Loans 9 — (15) — 166 160 (19)
Mortgage servicing rights 8,380 — (1,870) — (853) 5,657 (1,870)
Other financial assets measured on a recurring basis 1,171 — 86 422 (1,320) 359 86
Liabilities
Interest-bearing deposits $ 56 $ (5) $ — $ 13 $ (20) $ 54 $ (3)
Securities sold under agreements to repurchase 6,158 (273) — 6,158 (1,422) 11,167 (136)
Trading account liabilities
Securities sold, not yet purchased 473 153 — 1,036 (703) 653 328
Short-term borrowings 5,016 106 — (1,798) (1,783) 1,329 (63)
Long-term debt 8,953 2,228 — 38,792 (34,319) 11,198 1,115
Other financial liabilities measured on a recurring basis 1 — (61) — (61) 1 —
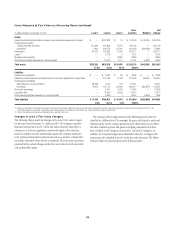
January 1,
2007
Net realized/unrealized
gains (losses) included in Transfers
in and/or
out of
Level 3
Purchases,
issuances
and
settlements
December 31,
2007
Unrealized
gains
(losses)
still held(3)
In millions of dollars
Principal
transactions Other (1) (2)
Assets
Securities purchased under agreements to resell $ 16 $ — $ — $ — $ — $ 16 $ —
Trading account assets
Trading securities and loans 22,415 (11,449) — 21,132 43,475 75,573 (10,262)
Investments 11,468 — 895 1,651 3,046 17,060 136
Loans — (8) — (793) 810 9 —
Mortgage servicing rights 5,439 — 621 — 2,320 8,380 1,892
Other financial assets measured on a recurring basis 948 — 2 (43) 264 1,171 20
Liabilities
Interest-bearing deposits $ 60 $ 12 $ 34 $ (33) $ 75 $ 56 $ (45)
Securities sold under agreements to repurchase 6,778 (194) — 78 (892) 6,158 (141)
Trading account liabilities
Securities sold, not yet purchased 467 (139) — (1,041) 908 473 (260)
Derivatives, net (4) (1,875) (3,840) — (3,280) 3,785 2,470 (9,462)
Short-term borrowings 2,214 9 (80) 1,139 1,592 5,016 (53)
Long-term debt 1,693 (11) (689) 4,600 1,960 8,953 (776)
Other financial liabilities measured on a recurring basis — — (23) (1) (21) 1 —
(1) Changes in fair value for available-for-sale investments (debt securities) are recorded in Accumulated other comprehensive income (loss), while gains from sales and losses due to other-than-temporary impairments are
recorded in Realized gains (losses) from sales of investments on the Consolidated Statement of Income.
(2) Unrealized gains (losses) on MSRs are recorded in Commissions and fees on the Consolidated Statement of Income.
(3) Represents the amount of total gains or losses for the period, included in earnings (and Accumulated other comprehensive income (loss) for changes in fair value of Available-for-sale investments) attributable to the
change in fair value relating to assets and liabilities classified as Level 3 that are still held at December 31, 2008 and 2007.
(4) Total Level 3 derivative exposures have been netted on these tables for presentation purposes only.
199