Citibank 2008 Annual Report Download - page 74
Download and view the complete annual report
Please find page 74 of the 2008 Citibank annual report below. You can navigate through the pages in the report by either clicking on the pages listed below, or by using the keyword search tool below to find specific information within the annual report.-
 1
1 -
2
-
3
-
4
-
5
-
6
-
7
-
8
-
9
-
10
-
11
-
12
-
13
-
14
-
15
-
16
-
17
-
18
-
19
-
20
-
21
-
22
-
23
-
24
-
25
-
26
-
27
-
28
-
29
-
30
-
31
-
32
-
33
-
34
-
35
-
36
-
37
-
38
-
39
-
40
-
41
-
42
-
43
-
44
-
45
-
46
-
47
-
48
-
49
-
50
-
51
-
52
-
53
-
54
-
55
-
56
-
57
-
58
-
59
-
60
-
61
-
62
-
63
-
 64
64 -
 65
65 -
 66
66 -
 67
67 -
 68
68 -
 69
69 -
 70
70 -
 71
71 -
 72
72 -
 73
73 -
 74
74 -
 75
75 -
 76
76 -
 77
77 -
 78
78 -
 79
79 -
 80
80 -
 81
81 -
 82
82 -
 83
83 -
 84
84 -
85
-
86
-
87
-
88
-
89
-
90
-
91
-
92
-
93
-
94
-
95
-
96
-
97
-
98
-
99
-
100
-
101
-
102
-
103
-
104
-
105
-
106
-
107
-
108
-
109
-
110
-
111
-
112
-
113
-
114
-
115
-
116
-
117
-
118
-
119
-
120
-
121
-
122
-
123
-
124
-
125
-
126
-
127
-
128
-
129
-
130
-
131
-
132
-
133
-
134
-
135
-
136
-
137
-
138
-
139
-
140
-
141
-
142
-
143
-
144
-
145
-
146
-
147
-
148
-
149
-
150
-
151
-
152
-
153
-
154
-
155
-
156
-
157
-
158
-
159
-
160
-
161
-
162
-
163
-
164
-
165
-
166
-
167
-
168
-
169
-
170
-
171
-
172
-
173
-
174
-
175
-
176
-
177
-
178
-
179
-
180
-
181
-
182
-
183
-
184
-
185
-
186
-
187
-
188
-
189
-
190
-
191
-
192
-
193
-
194
-
195
-
196
-
197
-
198
-
199
-
200
-
201
-
202
-
203
-
204
-
205
-
206
-
207
-
208
-
209
-
210
-
211
-
212
-
213
-
214
-
215
-
216
-
217
-
218
-
219
-
220
-
221
-
222
-
223
-
224
-
225
-
226
-
227
-
228
-
229
-
230
-
231
-
232
-
233
-
234
-
235
-
236
-
237
-
238
-
239
-
240
-
241
-
242
-
243
-
244
-
245
-
246
-
247
-
248
-
249
-
250
-
251
-
252
 |
 |

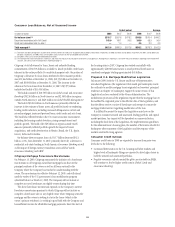
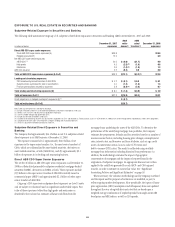
EXPOSURE TO U.S. REAL ESTATE IN SECURITIES AND BANKING
Subprime-Related Exposure in Securities and Banking
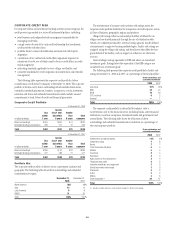
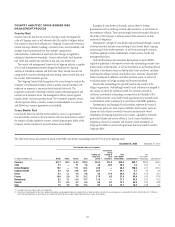
The following table summarizes Citigroup’s U.S. subprime-related direct exposures in Securities and Banking (S&B) at December 31, 2007 and 2008:
In billions of dollars
December 31, 2007
exposures
2008
write-
downs (1)
2008
sales/
transfers (2)
December 31, 2008
exposures
Direct ABS CDO super senior exposures:
Gross ABS CDO super senior exposures (A) $39.8 $18.9
Hedged exposures (B) 10.5 6.9
Net ABS CDO super senior exposures:
ABCP/CDO (3) 20.6 $ (9.0) $(1.7) 9.9
High grade 4.9 (2.5) (4) (1.6) 0.8
Mezzanine 3.6 (1.4) (4) (1.0) 1.3
ABS CDO-squared 0.2 (0.2) 0.0 0.0
Total net ABS CDO super senior exposures (A-B=C) $29.3 $(13.1) $(4.2) (5) $12.0
Lending and structuring exposures:
CDO warehousing/unsold tranches of ABS CDOs $ 0.2 $ (0.1) $ 0.0 $ 0.1
Subprime loans purchased for sale or securitization 4.0 (1.3) (1.4) 1.3
Financing transactions secured by subprime 3.8 (0.4) (4) (2.6) 0.7
Total lending and structuring exposures (D) $ 8.0 $ (1.8) $(4.0) $ 2.0
Total net exposures C+D (6) $37.3 $(14.9) $(8.3) $14.1
Credit adjustment on hedged counterparty exposures (E) (7) $ (5.7)
Total net write-downs (C+D+E) $(20.7)
Note: Table may not foot or cross-foot due to roundings.
(1) Includes net profits and losses associated with liquidations and amounts recorded on credit cash.
(2) Reflects sales, transfers and repayment or liquidations of principal.
(3) Consists of older-vintage, high-grade ABS CDOs.
(4) Includes $579 million recorded in credit costs.
(5) A portion of the underlying securities was purchased in liquidations of CDOs and reported as Trading account assets. As of December 31, 2008, $227 million relating to deals liquidated was held in the trading books.
(6) Composed of net CDO super-senior exposures and gross lending and structuring exposures.
(7) SFAS 157 adjustment related to counterparty credit risk.
Subprime-Related Direct Exposure in Securities and
Banking
The Company had approximately $14.1 billion in net U.S. subprime-related
direct exposures in its S&B business at December 31, 2008.
The exposure consisted of (a) approximately $12.0 billion of net
exposures in the super senior tranches (i.e., the most senior tranches) of
CDOs, which are collateralized by asset-backed securities, derivatives on
asset-backed securities, or both (ABS CDOs), and (b) approximately $2.1
billion of exposures in its lending and structuring business.
Direct ABS CDO Super Senior Exposures
The net $12.0 billion in ABS CDO super senior exposures as of December 31,
2008 is collateralized primarily by subprime residential mortgage-backed
securities (RMBS), derivatives on RMBS, or both. These exposures include
$9.9 billion in the super senior tranches of ABS CDOs initially issued as
commercial paper (ABCP) and approximately $2.1 billion of other super
senior tranches of ABS CDOs.
Citigroup’s CDO super senior subprime direct exposures are Level 3 assets
and are subject to valuation based on significant unobservable inputs. Fair
value of these exposures (other than high grade and mezzanine as
described below) is based on estimates of future cash flows from the
mortgage loans underlying the assets of the ABS CDOs. To determine the
performance of the underlying mortgage loan portfolios, the Company
estimates the prepayments, defaults and loss severities based on a number of
macroeconomic factors, including housing price changes, unemployment
rates, interest rates, and borrower and loan attributes, such as age, credit
scores, documentation status, loan-to-value (LTV) ratios and
debt-to-income (DTI) ratios. The model is calibrated using available
mortgage loan information including historical loan performance. In
addition, the methodology estimates the impact of geographic
concentration of mortgages and the impact of reported fraud in the
origination of subprime mortgages. An appropriate discount rate is then
applied to the cash flows generated for each ABCP- and CDO-squared
tranche, in order to estimate its current fair value. See “Significant
Accounting Policies and Significant Estimates” on page 18.
When necessary, the valuation methodology used by Citigroup is refined
and the inputs used for purposes of estimation are modified, in part, to
reflect ongoing market developments. More specifically, the inputs of home
price appreciation (HPA) assumptions and delinquency data were updated
throughout the year along with discount rates that are based upon a
weighted average combination of implied spreads from single-name ABS
bond prices and ABX indices, as well as CLO spreads.
68