Citibank 2008 Annual Report Download - page 204
Download and view the complete annual report
Please find page 204 of the 2008 Citibank annual report below. You can navigate through the pages in the report by either clicking on the pages listed below, or by using the keyword search tool below to find specific information within the annual report.-
 1
1 -
2
-
3
-
4
-
5
-
6
-
7
-
8
-
9
-
10
-
11
-
12
-
13
-
14
-
15
-
16
-
17
-
18
-
19
-
20
-
21
-
22
-
23
-
24
-
25
-
26
-
27
-
28
-
29
-
30
-
31
-
32
-
33
-
34
-
35
-
36
-
37
-
38
-
39
-
40
-
41
-
42
-
43
-
44
-
45
-
46
-
47
-
48
-
49
-
50
-
51
-
52
-
53
-
54
-
55
-
56
-
57
-
58
-
59
-
60
-
61
-
62
-
63
-
64
-
65
-
66
-
67
-
68
-
69
-
70
-
71
-
72
-
73
-
74
-
75
-
76
-
77
-
78
-
79
-
80
-
81
-
82
-
83
-
84
-
85
-
86
-
87
-
88
-
89
-
90
-
91
-
92
-
93
-
94
-
95
-
96
-
97
-
98
-
99
-
100
-
101
-
102
-
103
-
104
-
105
-
106
-
107
-
108
-
109
-
110
-
111
-
112
-
113
-
114
-
115
-
116
-
117
-
118
-
119
-
120
-
121
-
122
-
123
-
124
-
125
-
126
-
127
-
128
-
129
-
130
-
131
-
132
-
133
-
134
-
135
-
136
-
137
-
138
-
139
-
140
-
141
-
142
-
143
-
144
-
145
-
146
-
147
-
148
-
149
-
150
-
151
-
152
-
153
-
154
-
155
-
156
-
157
-
158
-
159
-
160
-
161
-
162
-
163
-
164
-
165
-
166
-
167
-
168
-
169
-
170
-
171
-
172
-
173
-
174
-
175
-
176
-
177
-
178
-
179
-
180
-
181
-
182
-
183
-
184
-
185
-
186
-
187
-
188
-
189
-
190
-
191
-
192
-
193
-
 194
194 -
 195
195 -
 196
196 -
 197
197 -
 198
198 -
 199
199 -
 200
200 -
 201
201 -
 202
202 -
 203
203 -
 204
204 -
 205
205 -
 206
206 -
 207
207 -
 208
208 -
 209
209 -
 210
210 -
 211
211 -
 212
212 -
 213
213 -
 214
214 -
215
-
216
-
217
-
218
-
219
-
220
-
221
-
222
-
223
-
224
-
225
-
226
-
227
-
228
-
229
-
230
-
231
-
232
-
233
-
234
-
235
-
236
-
237
-
238
-
239
-
240
-
241
-
242
-
243
-
244
-
245
-
246
-
247
-
248
-
249
-
250
-
251
-
252
 |
 |

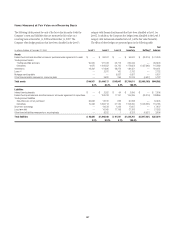
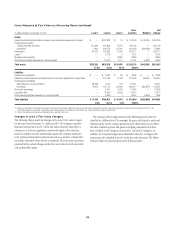
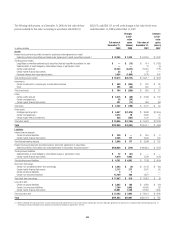
Items Measured at Fair Value on a Recurring Basis (continued)
In millions of dollars at December 31, 2007 Level 1 Level 2 Level 3
Gross
inventory Netting(1)
Net
balance
Assets
Federal funds sold and securities borrowed or purchased under agreements to resell $ — $132,383 $ 16 $ 132,399 $ (48,094) $ 84,305
Trading account assets
Trading securities and loans 151,684 234,846 75,573 462,103 — 462,103
Derivatives 7,204 428,779 31,226 467,209 (390,328) 76,881
Investments 64,375 125,282 17,060 206,717 — 206,717
Loans (2) — 3,718 9 3,727 — 3,727
Mortgage servicing rights — — 8,380 8,380 — 8,380
Other financial assets measured on a recurring basis — 13,570 1,171 14,741 (4,939) 9,802
Total assets $223,263 $938,578 $133,435 $1,295,276 $(443,361) $851,915
17.2% 72.5% 10.3% 100.0%
Liabilities
Interest-bearing deposits $ — $ 3,542 $ 56 $ 3,598 $ — $ 3,598
Federal funds purchased and securities loaned or sold under agreements to repurchase — 241,790 6,158 247,948 (48,094) 199,854
Trading account liabilities
Securities sold, not yet purchased 68,928 9,140 473 78,541 — 78,541
Derivatives 8,602 447,119 33,696 489,417 (385,876) 103,541
Short-term borrowings — 8,471 5,016 13,487 — 13,487
Long-term debt — 70,359 8,953 79,312 — 79,312
Other financial liabilities measured on a recurring basis — 6,506 1 6,507 (4,939) 1,568
Total liabilities $ 77,530 $786,927 $ 54,353 $ 918,810 $(438,909) $479,901
8.4% 85.7% 5.9% 100.0%
(1) Represents netting of: (i) the amounts due under securities purchased under agreements to resell and the amounts owed under securities sold under agreements to repurchase in accordance with FIN 41, and
(ii) derivative exposures covered by a qualifying master netting agreement in accordance with FIN 39, cash collateral and the market value adjustment.
(2) There is no allowance for loan losses recorded for loans reported at fair value.
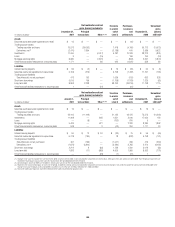
Changes in Level 3 Fair-Value Category
The following tables present the changes in the Level 3 fair-value category
for the years ended December 31, 2008 and 2007. The Company classifies
financial instruments in Level 3 of the fair-value hierarchy when there is
reliance on at least one significant unobservable input to the valuation
model. In addition to these unobservable inputs, the valuation models for
Level 3 financial instruments typically also rely on a number of inputs that
are readily observable either directly or indirectly. Thus, the gains and losses
presented below include changes in the fair value related to both observable
and unobservable inputs.
The Company often hedges positions with offsetting positions that are
classified in a different level. For example, the gains and losses for assets and
liabilities in the Level 3 category presented in the tables below do not reflect
the effect of offsetting losses and gains on hedging instruments that have
been classified by the Company in the Level 1 and Level 2 categories. In
addition, the Company hedges items classified in the Level 3 category with
instruments also classified in Level 3 of the fair-value hierarchy. The effects
of these hedges are presented gross in the following tables.
198