Citibank 2008 Annual Report Download - page 16
Download and view the complete annual report
Please find page 16 of the 2008 Citibank annual report below. You can navigate through the pages in the report by either clicking on the pages listed below, or by using the keyword search tool below to find specific information within the annual report.-
 1
1 -
2
-
3
-
4
-
5
-
 6
6 -
 7
7 -
 8
8 -
 9
9 -
 10
10 -
 11
11 -
 12
12 -
 13
13 -
 14
14 -
 15
15 -
 16
16 -
 17
17 -
 18
18 -
 19
19 -
 20
20 -
 21
21 -
 22
22 -
 23
23 -
 24
24 -
 25
25 -
 26
26 -
27
-
28
-
29
-
30
-
31
-
32
-
33
-
34
-
35
-
36
-
37
-
38
-
39
-
40
-
41
-
42
-
43
-
44
-
45
-
46
-
47
-
48
-
49
-
50
-
51
-
52
-
53
-
54
-
55
-
56
-
57
-
58
-
59
-
60
-
61
-
62
-
63
-
64
-
65
-
66
-
67
-
68
-
69
-
70
-
71
-
72
-
73
-
74
-
75
-
76
-
77
-
78
-
79
-
80
-
81
-
82
-
83
-
84
-
85
-
86
-
87
-
88
-
89
-
90
-
91
-
92
-
93
-
94
-
95
-
96
-
97
-
98
-
99
-
100
-
101
-
102
-
103
-
104
-
105
-
106
-
107
-
108
-
109
-
110
-
111
-
112
-
113
-
114
-
115
-
116
-
117
-
118
-
119
-
120
-
121
-
122
-
123
-
124
-
125
-
126
-
127
-
128
-
129
-
130
-
131
-
132
-
133
-
134
-
135
-
136
-
137
-
138
-
139
-
140
-
141
-
142
-
143
-
144
-
145
-
146
-
147
-
148
-
149
-
150
-
151
-
152
-
153
-
154
-
155
-
156
-
157
-
158
-
159
-
160
-
161
-
162
-
163
-
164
-
165
-
166
-
167
-
168
-
169
-
170
-
171
-
172
-
173
-
174
-
175
-
176
-
177
-
178
-
179
-
180
-
181
-
182
-
183
-
184
-
185
-
186
-
187
-
188
-
189
-
190
-
191
-
192
-
193
-
194
-
195
-
196
-
197
-
198
-
199
-
200
-
201
-
202
-
203
-
204
-
205
-
206
-
207
-
208
-
209
-
210
-
211
-
212
-
213
-
214
-
215
-
216
-
217
-
218
-
219
-
220
-
221
-
222
-
223
-
224
-
225
-
226
-
227
-
228
-
229
-
230
-
231
-
232
-
233
-
234
-
235
-
236
-
237
-
238
-
239
-
240
-
241
-
242
-
243
-
244
-
245
-
246
-
247
-
248
-
249
-
250
-
251
-
252
 |
 |

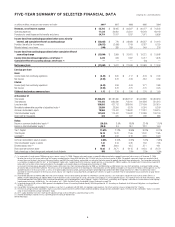
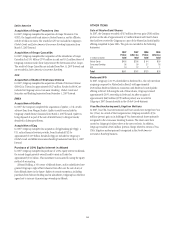
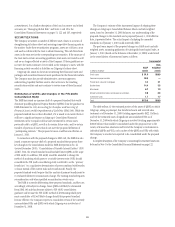
ITEMS IMPACTING THE SECURITIES AND BANKING BUSINESS
Securities and Banking Significant Revenue Items and Risk Exposure
Pretax Revenue
Marks
(in millions)
Risk Exposure
(in billions)
2008 2007 (1)
Dec. 31,
2008
Dec. 31,
2007 % Change
Sub-prime related direct exposures (2) $(14,283) $(18,312) $14.1 $37.3 (62)%
Monoline insurers Credit Valuation Adjustment (CVA) (5,736) (967) N/A N/A —
Highly leveraged loans and financing commitments (3) (4,892) (1,487) 10.0 43.2 (77)
Alt-A mortgage securities (4) (3,812) —12.6 22.0 (43)
Auction Rate Securities (ARS) (5) (1,733) —8.8 8.0 10
Commercial Real Estate (CRE) (6) (2,627) —37.5 53.7 (30)
Structured Investment Vehicles (SIVs) (3,269) —16.6 46.4 (63)
CVA on Citi liabilities at fair value option 4,558 888 N/A N/A —
Total significant revenue items $(31,794) $(19,878)
(1) Represents the third and fourth quarters of 2007, reflecting revenue marks since the commencement of the current credit crisis.
(2) Net of impact from hedges against direct subprime asset-backed securities collateralized debt obligation super senior positions.
(3) Net of underwriting fees.
(4) Net of hedges.
(5) Excludes losses of $306 million and $87 million in the third and fourth quarters of 2008, respectively, arising from the ARS legal settlement.
(6) Excludes CRE positions that are included in the SIV portfolio.
Subprime-Related Direct Exposures
In 2008, Securities and Banking (S&B) recorded losses of $14.3 billion
pretax, net of hedges, on its subprime-related direct exposures. The
Company’s remaining $14.1 billion in U.S. subprime net direct exposure in
S&B at December 31, 2008 consisted of (i) approximately $12.0 billion of
net exposures to the super senior tranches of CDOs, which are collateralized
by asset-backed securities, derivatives on asset-backed securities or both,
and (ii) approximately $2.1 billion of subprime-related exposures in its
lending and structuring business. In 2007, Citigroup recorded losses of
$18.3 billion pretax, net of hedges, on subprime-related direct exposures.
See “Exposure to U.S. Real Estate” on page 68 for a further discussion of
such exposures and the associated losses recorded.
Monoline Insurers Credit Valuation Adjustment (CVA)
During 2008, Citigroup recorded a pretax loss on CVA of $5.736 billion on
its exposure to monoline insurers. CVA is calculated by applying forward
default probabilities, which are derived using the counterparty’s current
credit spread, to the expected exposure profile. In 2007, the Company
recorded pretax losses of $967 million. The majority of the exposure relates
to hedges on super senior positions that were executed with various
monoline insurance companies. See “Direct Exposure to Monolines” on
page 70 for a further discussion.
Highly Leveraged Loans and Financing Commitments
Due to the continued dislocation of the credit markets and reduced market
interest in higher risk/higher yield instruments that began during the
second half of 2007, liquidity in the market for highly leveraged financings
has been very limited. This resulted in the Company’s recording pretax
losses of $4.892 billion on funded and unfunded highly leveraged finance
exposures in 2008 and $1.487 billion in 2007.
Citigroup’s exposure to highly leveraged financings totaled $10.0 billion
at December 31, 2008 ($9.1 billion in funded and $0.9 billion in unfunded
commitments), reflecting a decrease of $33.2 billion from December 31,
2007. See “Highly Leveraged Financing Commitments” on page 71 for
further discussion.
Alt-A Mortgage Securities
In 2008, Citigroup recorded pretax losses of approximately $3.812 billion,
net of hedges, on Alt-A mortgage securities held in S&B. For these purposes,
Alt-A mortgage securities are non-agency residential mortgage-backed
securities (RMBS) where (i) the underlying collateral has weighted average
FICO scores between 680 and 720 or (ii) for instances where FICO scores are
greater than 720, RMBS have 30% or less of the underlying collateral
composed of full documentation loans.
The Company had $12.6 billion in Alt-A mortgage securities at December
31, 2008, which decreased from $22.0 billion at December 31, 2007. Of the
$12.6 billion, $1.1 billion was classified as Trading account assets,on
which $2.201 billion of fair value losses, net of hedging, was recorded in
earnings, and $11.5 billion was classified as HTM investments, on which
$1.611 billion of losses were recorded in earnings due to other-than-
temporary impairments.
Auction Rate Securities (ARS)
In 2008, Citigroup recorded pretax losses of approximately $1.733 billion on
Auction Rate Securities (ARS). At December 31, 2008, the Company’s
exposure to ARS totaled $8.8 billion including both legacy positions and
ARS purchased under the ARS settlement agreement with the federal and
state regulators (see “Other Items” on page 13). Of the $8.8 billion, $5.5
billion is classified as held to maturity and $3.3 billion as available for sale
(AFS). The $8.8 billion comprises $3.7 billion of student loan ARS, $3.2
billion of preference share ARS backed by municipal or other taxable
securities, $1.4 billion of municipal ARS, and $0.5 billion of ARS backed by
other ABS.
10