Citibank 2008 Annual Report Download - page 173
Download and view the complete annual report
Please find page 173 of the 2008 Citibank annual report below. You can navigate through the pages in the report by either clicking on the pages listed below, or by using the keyword search tool below to find specific information within the annual report.-
 1
1 -
2
-
3
-
4
-
5
-
6
-
7
-
8
-
9
-
10
-
11
-
12
-
13
-
14
-
15
-
16
-
17
-
18
-
19
-
20
-
21
-
22
-
23
-
24
-
25
-
26
-
27
-
28
-
29
-
30
-
31
-
32
-
33
-
34
-
35
-
36
-
37
-
38
-
39
-
40
-
41
-
42
-
43
-
44
-
45
-
46
-
47
-
48
-
49
-
50
-
51
-
52
-
53
-
54
-
55
-
56
-
57
-
58
-
59
-
60
-
61
-
62
-
63
-
64
-
65
-
66
-
67
-
68
-
69
-
70
-
71
-
72
-
73
-
74
-
75
-
76
-
77
-
78
-
79
-
80
-
81
-
82
-
83
-
84
-
85
-
86
-
87
-
88
-
89
-
90
-
91
-
92
-
93
-
94
-
95
-
96
-
97
-
98
-
99
-
100
-
101
-
102
-
103
-
104
-
105
-
106
-
107
-
108
-
109
-
110
-
111
-
112
-
113
-
114
-
115
-
116
-
117
-
118
-
119
-
120
-
121
-
122
-
123
-
124
-
125
-
126
-
127
-
128
-
129
-
130
-
131
-
132
-
133
-
134
-
135
-
136
-
137
-
138
-
139
-
140
-
141
-
142
-
143
-
144
-
145
-
146
-
147
-
148
-
149
-
150
-
151
-
152
-
153
-
154
-
155
-
156
-
157
-
158
-
159
-
160
-
161
-
162
-
 163
163 -
 164
164 -
 165
165 -
 166
166 -
 167
167 -
 168
168 -
 169
169 -
 170
170 -
 171
171 -
 172
172 -
 173
173 -
 174
174 -
 175
175 -
 176
176 -
 177
177 -
 178
178 -
 179
179 -
 180
180 -
 181
181 -
 182
182 -
 183
183 -
184
-
185
-
186
-
187
-
188
-
189
-
190
-
191
-
192
-
193
-
194
-
195
-
196
-
197
-
198
-
199
-
200
-
201
-
202
-
203
-
204
-
205
-
206
-
207
-
208
-
209
-
210
-
211
-
212
-
213
-
214
-
215
-
216
-
217
-
218
-
219
-
220
-
221
-
222
-
223
-
224
-
225
-
226
-
227
-
228
-
229
-
230
-
231
-
232
-
233
-
234
-
235
-
236
-
237
-
238
-
239
-
240
-
241
-
242
-
243
-
244
-
245
-
246
-
247
-
248
-
249
-
250
-
251
-
252
 |
 |

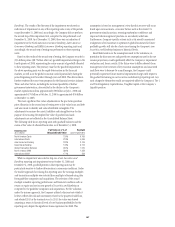
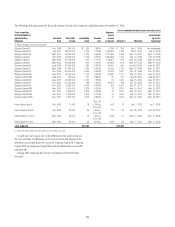
Banking). The results of the first step of the impairment test showed no
indication of impairment in any of the reporting units at any of the periods
except December 31, 2008 and, accordingly, the Company did not perform
the second step of the impairment test, except for the test performed as of
December 31, 2008. As of December 31, 2008, there was an indication of
impairment in the North America Consumer Banking,Latin America
Consumer Banking and EMEA Consumer Banking reporting units and,
accordingly, the second step of testing was performed on these reporting
units.
Based on the results of the second step of testing, the Company recorded a
$9.6 billion pretax ($8.7 billion after tax) goodwill impairment charge in the
fourth quarter of 2008, representing the entire amount of goodwill allocated
to these reporting units. The primary cause for the goodwill impairment in
the above reporting units was the rapid deterioration in the financial
markets, as well as in the global economic outlook particularly during the
period beginning mid-November through year end 2008. This deterioration
further weakened the near-term prospects for the financial services industry.
These and other factors, including the increased possibility of further
government intervention, also resulted in the decline in the Company’s
market capitalization from approximately $90 billion at July 1, 2008 and
approximately $74 billion at October 31, 2008 to approximately $36 billion
at December 31, 2008.
The more significant fair-value adjustments in the pro forma purchase
price allocation in the second step of testing were to fair-value loans and debt
and were made to identify and value identifiable intangibles. The
adjustments to measure the assets, liabilities and intangibles were for the
purpose of measuring the implied fair value of goodwill and such
adjustments are not reflected in the Consolidated Balance Sheet.
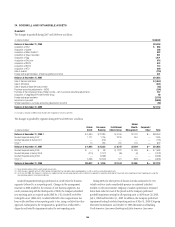
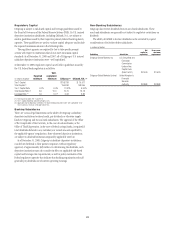
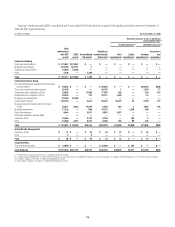
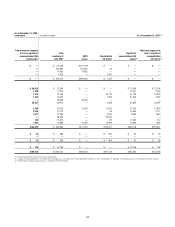
The following table shows reporting units with goodwill balances and the
excess of fair value of allocated book value as of December 31, 2008.
Reporting Unit
($ in millions)
Fair Value as a % of
Allocated Book Value
Goodwill
(post-impairment)
North America Cards 139% 6,765
International Cards 218% 4,066
Asia Consumer Banking 293% 3,106
Securities & Banking 109% 9,774
Global Transaction Services 994% 1,570
North America GWM 386% 1,259
International GWM 171% 592
While no impairment was noted in step one of our Securities and
Banking reporting unit impairment test at October 31, 2008 and
December 31, 2008, goodwill present in that reporting unit may be
particularly sensitive to further deterioration in economic conditions. Under
the market approach for valuing this reporting unit, the earnings multiples
and transaction multiples were selected from multiples obtained using data
from guideline companies and acquisitions. The selection of the actual
multiple considers operating performance and financial condition such as
return on equity and net income growth of Securities and Banking as
compared to the guideline companies and acquisitions. For the valuation
under the income approach, the Company utilized a discount rate which it
believes reflects the risk and uncertainty related to the projected cash flows,
and selected 2013 as the terminal year. In 2013, the value was derived
assuming a return to historical levels of core-business profitability for the
reporting unit, despite the significant losses experienced in 2008. This
assumption is based on management’s view that this recovery will occur
based upon various macro- economic factors such as the recent U.S.
government stimulus actions, restoring marketplace confidence and
improved risk-management practices on an industry-wide basis.
Furthermore, Company-specific actions such as its recently announced
realignment of its businesses to optimize its global businesses for future
profitable growth, will also be a factor in returning the Company’s core
Securities and Banking business to historical levels.
Small deterioration in the assumptions used in the valuations, in
particular the discount rate and growth rate assumptions used in the net
income projections, could significantly affect the Company’s impairment
evaluation and, hence, results. If the future were to differ adversely from
management’s best estimate of key economic assumptions and associated
cash flows were to decrease by a small margin, the Company could
potentially experience future material impairment charges with respect to
the goodwill remaining in our Securities and Banking reporting unit. Any
such charges by themselves would not negatively affect the Company’s Tier 1
and Total Regulatory Capital Ratios, Tangible Capital or the Company’s
liquidity position.
167