Citibank 2008 Annual Report Download - page 66
Download and view the complete annual report
Please find page 66 of the 2008 Citibank annual report below. You can navigate through the pages in the report by either clicking on the pages listed below, or by using the keyword search tool below to find specific information within the annual report.-
 1
1 -
2
-
3
-
4
-
5
-
6
-
7
-
8
-
9
-
10
-
11
-
12
-
13
-
14
-
15
-
16
-
17
-
18
-
19
-
20
-
21
-
22
-
23
-
24
-
25
-
26
-
27
-
28
-
29
-
30
-
31
-
32
-
33
-
34
-
35
-
36
-
37
-
38
-
39
-
40
-
41
-
42
-
43
-
44
-
45
-
46
-
47
-
48
-
49
-
50
-
51
-
52
-
53
-
54
-
55
-
 56
56 -
 57
57 -
 58
58 -
 59
59 -
 60
60 -
 61
61 -
 62
62 -
 63
63 -
 64
64 -
 65
65 -
 66
66 -
 67
67 -
 68
68 -
 69
69 -
 70
70 -
 71
71 -
 72
72 -
 73
73 -
 74
74 -
 75
75 -
 76
76 -
77
-
78
-
79
-
80
-
81
-
82
-
83
-
84
-
85
-
86
-
87
-
88
-
89
-
90
-
91
-
92
-
93
-
94
-
95
-
96
-
97
-
98
-
99
-
100
-
101
-
102
-
103
-
104
-
105
-
106
-
107
-
108
-
109
-
110
-
111
-
112
-
113
-
114
-
115
-
116
-
117
-
118
-
119
-
120
-
121
-
122
-
123
-
124
-
125
-
126
-
127
-
128
-
129
-
130
-
131
-
132
-
133
-
134
-
135
-
136
-
137
-
138
-
139
-
140
-
141
-
142
-
143
-
144
-
145
-
146
-
147
-
148
-
149
-
150
-
151
-
152
-
153
-
154
-
155
-
156
-
157
-
158
-
159
-
160
-
161
-
162
-
163
-
164
-
165
-
166
-
167
-
168
-
169
-
170
-
171
-
172
-
173
-
174
-
175
-
176
-
177
-
178
-
179
-
180
-
181
-
182
-
183
-
184
-
185
-
186
-
187
-
188
-
189
-
190
-
191
-
192
-
193
-
194
-
195
-
196
-
197
-
198
-
199
-
200
-
201
-
202
-
203
-
204
-
205
-
206
-
207
-
208
-
209
-
210
-
211
-
212
-
213
-
214
-
215
-
216
-
217
-
218
-
219
-
220
-
221
-
222
-
223
-
224
-
225
-
226
-
227
-
228
-
229
-
230
-
231
-
232
-
233
-
234
-
235
-
236
-
237
-
238
-
239
-
240
-
241
-
242
-
243
-
244
-
245
-
246
-
247
-
248
-
249
-
250
-
251
-
252
 |
 |

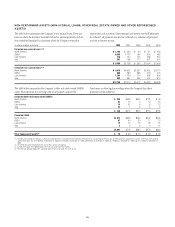
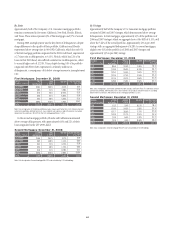
Interest Rate Risk Associated with Consumer Mortgage
Lending Activity
Citigroup originates and funds mortgage loans. As with all other lending
activity, this exposes Citigroup to several risks, including credit, liquidity and
interest rate risks. To manage credit and liquidity risk, Citigroup sells most of
the mortgage loans it originates, but retains the servicing rights. These sale
transactions create an intangible asset referred to as mortgage servicing
rights (MSRs). The fair value of this asset is primarily affected by changes in
prepayments that result from shifts in mortgage interest rates. Thus, by
retaining the servicing rights of sold mortgage loans, Citigroup is still
exposed to interest rate risk.
In managing this risk, Citigroup hedges a significant portion of the value
of its MSRs through the use of interest rate derivative contracts, forward
purchase commitments of mortgage-backed securities, and purchased
securities classified as trading (primarily mortgage-backed securities
including principal-only strips).
Since the change in the value of these hedging instruments does not
perfectly match the change in the value of the MSRs, Citigroup is still
exposed to what is commonly referred to as “basis risk.” Citigroup manages
this risk by reviewing the mix of the various hedging instruments referred to
above on a daily basis.
Citigroup’s MSRs totaled $5.567 billion and $8.380 billion at December 31,
2008 and 2007, respectively. For additional information about the Company’s
MSRs, see Note 19 to the Consolidated Financial Statements on page 166.
As part of the mortgage lending activity, Citigroup commonly enters into
purchase commitments to fund residential mortgage loans at specific
interest rates within a given period of time, generally up to 60 days after the
rate has been set. If the resulting loans from these commitments will be
classified as loans held-for-sale, Citigroup accounts for the commitments as
derivatives under SFAS 133. Accordingly, changes in the fair value of these
commitments, which are driven by changes in mortgage interest rates, are
recognized in current earnings after taking into consideration the likelihood
that the commitment will be funded. However, a value is not assigned to the
MSRs until after the loans have been funded and sold.
Citigroup hedges its exposure to the change in the value of these commitments
by utilizing hedging instruments similar to those referred to above.
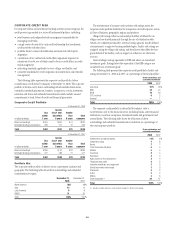
The Company has risk-sharing agreements with various Mortgage
Insurance (MI) companies through company-owned captive reinsurance
entities. Under these arrangements, the Company shares in MI premium
revenue and participates in losses above a predetermined level (floor), limited
by a predetermined loss amount (ceiling), at which time additional losses
revert back to the MI companies. The agreements currently support a total of
$28.1 billion of loans with $7.1 billion of MI coverage, principally on loans sold
to government agencies. During 2008, projections by the MI companies
indicated that losses for some books of business were likely to exceed the floor
and the Company recorded $67 million in reserves. Total maximum exposure
under these captive reinsurance agreements is $1.3 billion.
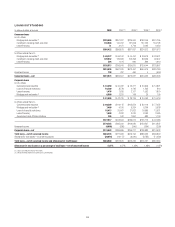
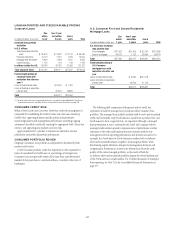
U.S. Consumer Mortgage Lending Portfolio
The Company’s U.S. Consumer mortgage portfolio consists of both first and
second mortgages, originated primarily by the N.A. Consumer Banking
business. As of December 31, 2008, the first mortgage portfolio totaled
approximately $134 billion while the second mortgage portfolio was
approximately $59 billion.
In some cases, some specific portfolios have been excluded from or added
to the information presented below, generally due to differences in
methodology or variations in the manner in which information is captured.
We have noted such exclusions or additions in instances where the Company
believes they could be material to reconcile the information presented. North
America Residential Real Estate lending disclosure excludes approximately
$19 billion of consumer mortgage loans in Global Wealth Management
(GWM). The GWM loans are primarily in the U.S. business and typically
have better aggregate risk characteristics than those in the U.S. Consumer
portfolio.
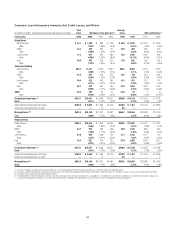
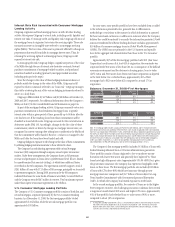
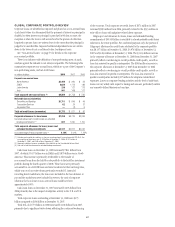
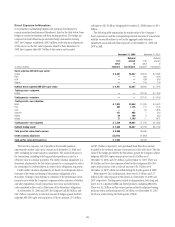
Approximately 83% of the first mortgage portfolio had FICO (Fair Isaac
Corporation) credit scores of at least 620 at origination; the remainder was
originated with FICO scores of less than 620. As a consequence of the difficult
economic environment and the decrease in housing prices, loan-to-value
(LTV) ratios and FICO scores have deteriorated since origination as depicted
in the table below. On a refreshed basis, approximately 26% of first
mortgages had a FICO score below 620, compared to around 17% at
origination.
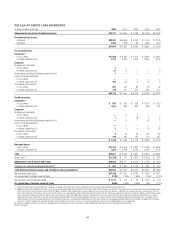
Balances: December 31, 2008—First Mortgages
LTV 80%
80%<LTV<90%
LTV 90%
FICO<620
7%
4%
6%
620 FICO
<660
6%
2%
5%
FICO 660
57%
4%
9%
AT
ORIGINATION
LTV 80%
80%<LTV<90%
LTV 90%
FICO<620
12%
5%
9%
620 FICO
<660
5%
2%
3%
FICO 660
42%
9%
13%
REFRESHED
Note: First mortgage table excludes Canada and Puerto Rico ($2.0 billion) and First Collateral Services
($0.1 billion commercial loans portfolio). Refreshed FICO scores based on updated credit scores obtained
from Fair Isaac Corporation. Refreshed LTV ratios are derived from data at origination updated using mainly
the S&P/Case-Shiller Home Price Index or the Office of Federal Housing Enterprise Oversight Housing Price
Index. Tables exclude $2.6 billion from At Origination balances and $9.9 billion from Refreshed balances
for which FICO and LTV data was unavailable. 90+ DPD delinquency rate for the excluded mortgages is
4.69% and 4.06% respectively, vs. 5.66% for total portfolio. Excluding Government insured loans
(described below), the 90+DPD delinquency rate for the first mortgage portfolio is 5.13%.
The Company’s first mortgage portfolio includes $3.3 billion of loans with
Federal Housing Administration or Veterans Administration guarantees.
These portfolios consist of loans originated to low-to-moderate-income
borrowers with lower FICO scores and generally have higher LTVs. These
loans have high delinquency rates (approximately 35% 90+DPD) but, given
the government insurance, the Company has experienced negligible credit
losses on these loans. The first mortgage portfolio also includes $2.0 billion
of loans with LTVs above 80% which have insurance through private
mortgage insurance companies and $4.7 billion of loans subject to Long-
Term Standby Commitments1with Government Sponsored Enterprises
(GSE), for which the Company has limited exposure to credit losses.
In the second mortgage portfolio, the majority of loans are in the higher
FICO categories. However, the challenging economic conditions have created
a migration towards lower FICO scores and higher LTV ratios. Approximately
43% of that portfolio had refreshed loan-to-value ratios of 90% or more,
compared to about 30% at origination.
1 A Long-Term Standby Commitment (LTSC) is a structured transaction in which the Company transfers
the credit risk of certain eligible loans to an investor in exchange for a fee. These loans remain on
balance sheet unless they reach a certain delinquency level (between 120 and 180 days), in which
case the LTSC investor is required to buy the loan at par.
60