Citibank 2008 Annual Report Download - page 180
Download and view the complete annual report
Please find page 180 of the 2008 Citibank annual report below. You can navigate through the pages in the report by either clicking on the pages listed below, or by using the keyword search tool below to find specific information within the annual report.-
 1
1 -
2
-
3
-
4
-
5
-
6
-
7
-
8
-
9
-
10
-
11
-
12
-
13
-
14
-
15
-
16
-
17
-
18
-
19
-
20
-
21
-
22
-
23
-
24
-
25
-
26
-
27
-
28
-
29
-
30
-
31
-
32
-
33
-
34
-
35
-
36
-
37
-
38
-
39
-
40
-
41
-
42
-
43
-
44
-
45
-
46
-
47
-
48
-
49
-
50
-
51
-
52
-
53
-
54
-
55
-
56
-
57
-
58
-
59
-
60
-
61
-
62
-
63
-
64
-
65
-
66
-
67
-
68
-
69
-
70
-
71
-
72
-
73
-
74
-
75
-
76
-
77
-
78
-
79
-
80
-
81
-
82
-
83
-
84
-
85
-
86
-
87
-
88
-
89
-
90
-
91
-
92
-
93
-
94
-
95
-
96
-
97
-
98
-
99
-
100
-
101
-
102
-
103
-
104
-
105
-
106
-
107
-
108
-
109
-
110
-
111
-
112
-
113
-
114
-
115
-
116
-
117
-
118
-
119
-
120
-
121
-
122
-
123
-
124
-
125
-
126
-
127
-
128
-
129
-
130
-
131
-
132
-
133
-
134
-
135
-
136
-
137
-
138
-
139
-
140
-
141
-
142
-
143
-
144
-
145
-
146
-
147
-
148
-
149
-
150
-
151
-
152
-
153
-
154
-
155
-
156
-
157
-
158
-
159
-
160
-
161
-
162
-
163
-
164
-
165
-
166
-
167
-
168
-
169
-
 170
170 -
 171
171 -
 172
172 -
 173
173 -
 174
174 -
 175
175 -
 176
176 -
 177
177 -
 178
178 -
 179
179 -
 180
180 -
 181
181 -
 182
182 -
 183
183 -
 184
184 -
 185
185 -
 186
186 -
 187
187 -
 188
188 -
 189
189 -
 190
190 -
191
-
192
-
193
-
194
-
195
-
196
-
197
-
198
-
199
-
200
-
201
-
202
-
203
-
204
-
205
-
206
-
207
-
208
-
209
-
210
-
211
-
212
-
213
-
214
-
215
-
216
-
217
-
218
-
219
-
220
-
221
-
222
-
223
-
224
-
225
-
226
-
227
-
228
-
229
-
230
-
231
-
232
-
233
-
234
-
235
-
236
-
237
-
238
-
239
-
240
-
241
-
242
-
243
-
244
-
245
-
246
-
247
-
248
-
249
-
250
-
251
-
252
 |
 |

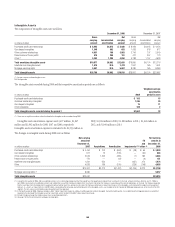
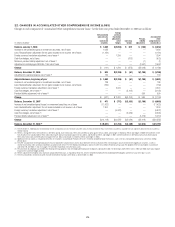
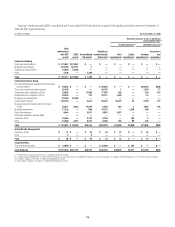
22. CHANGES IN ACCUMULATED OTHER COMPREHENSIVE INCOME (LOSS)
Changes in each component of “Accumulated Other Comprehensive Income (Loss)” for the three-year period ended December 31, 2008 are as follows:
In millions of dollars
Net unrealized
gains (losses)
on
investment
securities
Foreign
currency
translation
adjustment,
net of
hedges
Cash flow
hedges
Pension
liability
adjustments
Accumulated
other
comprehensive
income (loss)
Balance, January 1, 2006 $ 1,084 $(4,090) $ 612 $ (138) $ (2,532)
Increase in net unrealized gains on investment securities, net of taxes 1,023 — — — 1,023
Less: Reclassification adjustment for net gains included in net income, net of taxes (1,164) — — — (1,164)
Foreign currency translation adjustment, net of taxes (2) — 1,294 — — 1,294
Cash flow hedges, net of taxes — — (673) — (673)
Minimum pension liability adjustment, net of taxes (3) — — — (1) (1)
Adjustment to initially apply SFAS No. 158, net of taxes — — — (1,647) (1,647)
Change $ (141) $ 1,294 $ (673) $(1,648) $ (1,168)
Balance, December 31, 2006 $ 943 $(2,796) $ (61) $(1,786) $ (3,700)
Adjustment to opening balance, net of taxes (4) 149 — — — 149
Adjusted balance, beginning of year $ 1,092 $(2,796) $ (61) $(1,786) $ (3,551)
Increase in net unrealized gains on investment securities, net of taxes 138 — — — 138
Less: Reclassification adjustment for net gains included in net income, net of taxes (759) — — — (759)
Foreign currency translation adjustment, net of taxes (2) — 2,024 — — 2,024
Cash flow hedges, net of taxes (5) — — (3,102) — (3,102)
Pension liability adjustment, net of taxes (6) — — — 590 590
Change $ (621) $ 2,024 $(3,102) $ 590 $ (1,109)
Balance, December 31, 2007 $ 471 $ (772) $(3,163) $(1,196) $ (4,660)
Increase in net unrealized gains (losses) on investment securities, net of taxes (11,422) — — — (11,422)
Less: Reclassification adjustment for net losses included in net income, net of taxes 1,304 — — — 1,304
Foreign currency translation adjustment, net of taxes (2) — (6,972) — — (6,972)
Cash flow hedges, net of taxes (5) — — (2,026) — (2,026)
Pension liability adjustment, net of taxes (6) — — — (1,419) (1,419)
Change $(10,118) $(6,972) $(2,026) $(1,419) $(20,535)
Balance, December 31, 2008 (1) $ (9,647) $(7,744) $(5,189) $(2,615) $(25,195)
(1) The December 31, 2008 balance of $(9.6) billion for net unrealized losses on investment securities consists of $(4.4) billion for those investments classified as available-for-sale and $(5.2) billion for those classified as
held-to-maturity.
(2) Reflects, among other items: the movements in the British pound, Euro, Korean won, Polish zloty and Mexican peso against the U.S. dollar, and changes in related tax effects and hedges in 2006; the movements in the
Euro, Brazilian real, Canadian dollar, Polish zloty, Indian rupee and Australian dollar against the U.S. dollar, and related tax effects and hedges in 2007; and the movements in the Mexican peso, Euro, British pound,
Polish zloty, Korean won and the Brazilian real against the U.S. dollar, and changes in related tax effects and hedges in 2008.
(3) Additional minimum liability, as required by SFAS No. 87, Employers’ Accounting for Pensions (SFAS 87), related to unfunded or book reserve plans, such as the U.S. nonqualified pension plans and certain foreign
pension plans.
(4) The after-tax adjustment to the opening balance of Accumulated other comprehensive income (loss) represents the reclassification of the unrealized gains (losses) related to the Legg Mason securities, as well as
several miscellaneous items previously reported in accordance with SFAS 115. The related unrealized gains and losses were reclassified to Retained earnings upon the adoption of the fair value option in accordance
with SFAS 159. See Notes 1 and 27 on pages 122 and 202, respectively, for further discussions.
(5) Primarily driven by Citigroup’s pay fixed/receive floating rate swap programs that are hedging the floating rate on deposits and long-term debt. The declining market interest rates in 2007 and 2008 have had a negative
impact on the cash flow hedges portfolio.
(6) Reflects adjustments to funded status of pension and postretirement plans as required by SFAS 158, which is the difference between the projected benefit obligation and the fair value of the plans’ assets.
(7) The net unrealized loss related to securities transferred to held-to-maturity is $5.2 billion as of December 31, 2008.
174