Citibank 2008 Annual Report Download - page 85
Download and view the complete annual report
Please find page 85 of the 2008 Citibank annual report below. You can navigate through the pages in the report by either clicking on the pages listed below, or by using the keyword search tool below to find specific information within the annual report.-
 1
1 -
2
-
3
-
4
-
5
-
6
-
7
-
8
-
9
-
10
-
11
-
12
-
13
-
14
-
15
-
16
-
17
-
18
-
19
-
20
-
21
-
22
-
23
-
24
-
25
-
26
-
27
-
28
-
29
-
30
-
31
-
32
-
33
-
34
-
35
-
36
-
37
-
38
-
39
-
40
-
41
-
42
-
43
-
44
-
45
-
46
-
47
-
48
-
49
-
50
-
51
-
52
-
53
-
54
-
55
-
56
-
57
-
58
-
59
-
60
-
61
-
62
-
63
-
64
-
65
-
66
-
67
-
68
-
69
-
70
-
71
-
72
-
73
-
74
-
 75
75 -
 76
76 -
 77
77 -
 78
78 -
 79
79 -
 80
80 -
 81
81 -
 82
82 -
 83
83 -
 84
84 -
 85
85 -
 86
86 -
 87
87 -
 88
88 -
 89
89 -
 90
90 -
 91
91 -
 92
92 -
 93
93 -
 94
94 -
 95
95 -
96
-
97
-
98
-
99
-
100
-
101
-
102
-
103
-
104
-
105
-
106
-
107
-
108
-
109
-
110
-
111
-
112
-
113
-
114
-
115
-
116
-
117
-
118
-
119
-
120
-
121
-
122
-
123
-
124
-
125
-
126
-
127
-
128
-
129
-
130
-
131
-
132
-
133
-
134
-
135
-
136
-
137
-
138
-
139
-
140
-
141
-
142
-
143
-
144
-
145
-
146
-
147
-
148
-
149
-
150
-
151
-
152
-
153
-
154
-
155
-
156
-
157
-
158
-
159
-
160
-
161
-
162
-
163
-
164
-
165
-
166
-
167
-
168
-
169
-
170
-
171
-
172
-
173
-
174
-
175
-
176
-
177
-
178
-
179
-
180
-
181
-
182
-
183
-
184
-
185
-
186
-
187
-
188
-
189
-
190
-
191
-
192
-
193
-
194
-
195
-
196
-
197
-
198
-
199
-
200
-
201
-
202
-
203
-
204
-
205
-
206
-
207
-
208
-
209
-
210
-
211
-
212
-
213
-
214
-
215
-
216
-
217
-
218
-
219
-
220
-
221
-
222
-
223
-
224
-
225
-
226
-
227
-
228
-
229
-
230
-
231
-
232
-
233
-
234
-
235
-
236
-
237
-
238
-
239
-
240
-
241
-
242
-
243
-
244
-
245
-
246
-
247
-
248
-
249
-
250
-
251
-
252
 |
 |
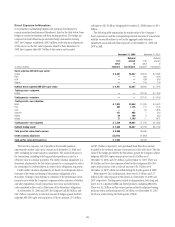
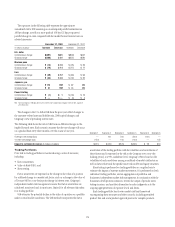
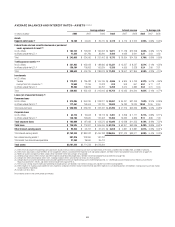
• $12 billion, or 38%, increase in U.S. Treasury and federal agency
securities;
• $5 billion, or 10%, increase in foreign government securities; and
• $13 billion, or 85%, net increase in other trading securities.
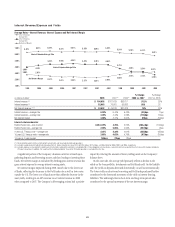
Total average trading account assets were $381 billion in 2008, compared
to $441 billion in 2007, yielding average rates of 4.6% and 4.2%, respectively.
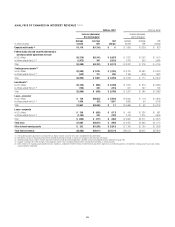
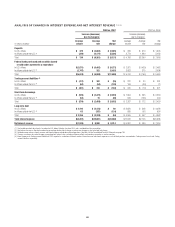
During 2008 trading account liabilities decreased by $15 billion, or 8%,
due to:
• $13 billion, or 13%, increase in revaluation losses primarily consisting of
increases from interest rates, foreign exchange and credit derivative
contracts, offset by an increase in netting permitted under master netting
agreements; and
• $28 billion, or 35%, decrease in securities sold, not yet purchased,
comprising a $28 billion decrease in debt securities, while U.S. Treasury
securities remained flat.
In 2008, average trading account liabilities were $76 billion, yielding an
average rate of 1.7%, compared to $105 billion and 1.4% in the prior year.
For further discussion regarding trading account assets and liabilities, see
Note 15 to the Consolidated Financial Statements on page 157.
Federal Funds Sold (Purchased) and Securities Borrowed
(Loaned) or Purchased (Sold) Under Agreements to
Resell (Repurchase)
Federal funds sold and federal funds purchased consist of unsecured
advances of excess balances in reserve accounts held at Federal Reserve
banks. When the Company advances federal funds to a third party, it is
selling its excess reserves. Similarly, when the Company receives federal
funds, the Company is purchasing reserves from a third party. These interest-
bearing transactions typically have an original maturity of one business day.
Securities borrowed and securities loaned are recorded at the amount of
cash advanced or received, with a minimal amount adjusted for fair value in
accordance with SFAS 159. With respect to securities borrowed, the Company
pays cash collateral in an amount in excess of the market value of securities
borrowed, and receives excess in the case of securities loaned. The Company
monitors the market value of securities borrowed and loaned on a daily basis
with additional collateral advanced or obtained as necessary. Interest
received or paid for these transactions is recorded in interest income or
interest expense.
Securities purchased under agreements to resell and securities sold under
agreements to repurchase are treated as collateralized financing transactions
and are primarily carried at fair value in accordance with SFAS 159 since
January 1, 2007. In prior periods, these agreements were carried at cost. The
Company’s policy is to take possession of securities purchased under
agreements to resell. The market value of securities to be repurchased and
resold is monitored, and additional collateral is obtained where appropriate
to protect against credit exposure.
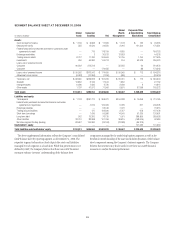
During 2008 the decrease of $90 billion, or 33%, in federal funds sold and
securities borrowed or purchased under agreements to resell, and the
decrease of $99 billion, or 33%, in federal funds purchased and securities
loaned or sold under agreements to repurchase were primarily driven by
balance sheet management.
For further information regarding these balance sheet categories, see
Note 13 to the Consolidated Financial Statements on page 156.
Investments
Investments consist of debt and equity securities that are available-for-sale,
debt securities that are held-to-maturity, non-marketable equity securities
that are carried at fair value, and non-marketable equity securities carried at
cost. Debt securities include bonds, notes and redeemable preferred stock, as
well as loan-backed securities (such as mortgage-backed securities) and
other structured notes. Marketable and non-marketable equity securities
carried at fair value include common and nonredeemable preferred stocks.
These instruments provide the Company with long-term investment
opportunities while in most cases remaining relatively liquid.
Non-marketable equity securities carried at cost primarily include equity
shares issued by the Federal Reserve Bank and the Federal Home Loan Bank
that the Company is required to hold.
Investment securities classified as available-for-sale are primarily carried
at fair value with the changes in fair value generally recognized in
stockholders’ equity (accumulated other comprehensive income). Declines
in fair value that are deemed other-than-temporary, as well as gains and
losses from the sale of these investment securities, are recognized in current
earnings. Certain investments in non-marketable equity securities and
certain investments that would otherwise be accounted for using the equity
method are carried at fair value in accordance with SFAS 159. Changes in
fair value of such investments are recorded in earnings. Debt securities
classified as held-to-maturity are carried at cost unless a decline in fair value
below cost is deemed other-than-temporary, in which case such a decline is
recorded in current earnings.
During 2008, investments increased by $41 billion, or 19%, principally
due to the transfer of debt securities from Trading assets to Investments as
discussed in the section “Reclassification of Financial Assets” on page 87.
For further information regarding investments, see Note 16 to the
Consolidated Financial Statements on page 158.
Other Assets
Other assets are composed of cash and due from banks, deposits with banks,
brokerage receivables, goodwill, intangibles, and various other assets.
During 2008, other assets increased $58 billion, or 15%, due to the $101
billion increase in deposits with banks and the $31 billion increase in the
deferred tax asset. These increases were offset by the following decreases:
• $41 billion related to loans held-for-sale as they were reclassed to loans
held-for-investment (for further discussion, see “Reclassification of
Financial Assets” on page 87);
• $17 billion in goodwill and intangibles, driven by the impairment of
goodwill and intangibles, foreign exchange translation and the decrease
in the fair value of the MSR;
• $13 billion in brokerage receivables; and
• $3 billion in various other assets.
For further information regarding goodwill and intangibles, see Note 19
to the Consolidated Financial Statements on page 166. For further discussion
on brokerage receivables, see Note 14 to the Consolidated Financial
Statements on page 157.
Deposits
Deposits represent customer funds that are payable on demand or upon
maturity. The majority of deposits are carried at cost, with a minimal
amount recorded at fair value in accordance with SFAS 155 and SFAS 159.
79