Citibank 2008 Annual Report Download - page 46
Download and view the complete annual report
Please find page 46 of the 2008 Citibank annual report below. You can navigate through the pages in the report by either clicking on the pages listed below, or by using the keyword search tool below to find specific information within the annual report.-
 1
1 -
2
-
3
-
4
-
5
-
6
-
7
-
8
-
9
-
10
-
11
-
12
-
13
-
14
-
15
-
16
-
17
-
18
-
19
-
20
-
21
-
22
-
23
-
24
-
25
-
26
-
27
-
28
-
29
-
30
-
31
-
32
-
33
-
34
-
35
-
 36
36 -
 37
37 -
 38
38 -
 39
39 -
 40
40 -
 41
41 -
 42
42 -
 43
43 -
 44
44 -
 45
45 -
 46
46 -
 47
47 -
 48
48 -
 49
49 -
 50
50 -
 51
51 -
 52
52 -
 53
53 -
 54
54 -
 55
55 -
 56
56 -
57
-
58
-
59
-
60
-
61
-
62
-
63
-
64
-
65
-
66
-
67
-
68
-
69
-
70
-
71
-
72
-
73
-
74
-
75
-
76
-
77
-
78
-
79
-
80
-
81
-
82
-
83
-
84
-
85
-
86
-
87
-
88
-
89
-
90
-
91
-
92
-
93
-
94
-
95
-
96
-
97
-
98
-
99
-
100
-
101
-
102
-
103
-
104
-
105
-
106
-
107
-
108
-
109
-
110
-
111
-
112
-
113
-
114
-
115
-
116
-
117
-
118
-
119
-
120
-
121
-
122
-
123
-
124
-
125
-
126
-
127
-
128
-
129
-
130
-
131
-
132
-
133
-
134
-
135
-
136
-
137
-
138
-
139
-
140
-
141
-
142
-
143
-
144
-
145
-
146
-
147
-
148
-
149
-
150
-
151
-
152
-
153
-
154
-
155
-
156
-
157
-
158
-
159
-
160
-
161
-
162
-
163
-
164
-
165
-
166
-
167
-
168
-
169
-
170
-
171
-
172
-
173
-
174
-
175
-
176
-
177
-
178
-
179
-
180
-
181
-
182
-
183
-
184
-
185
-
186
-
187
-
188
-
189
-
190
-
191
-
192
-
193
-
194
-
195
-
196
-
197
-
198
-
199
-
200
-
201
-
202
-
203
-
204
-
205
-
206
-
207
-
208
-
209
-
210
-
211
-
212
-
213
-
214
-
215
-
216
-
217
-
218
-
219
-
220
-
221
-
222
-
223
-
224
-
225
-
226
-
227
-
228
-
229
-
230
-
231
-
232
-
233
-
234
-
235
-
236
-
237
-
238
-
239
-
240
-
241
-
242
-
243
-
244
-
245
-
246
-
247
-
248
-
249
-
250
-
251
-
252
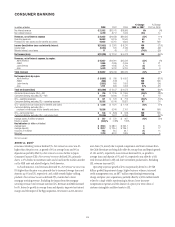
 |
 |

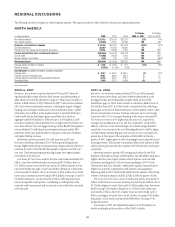
EMEA
In millions of dollars 2008 2007 2006
% Change
2008 vs. 2007
% Change
2007 vs. 2006
Net interest revenue $ 8,618 $ 7,067 $ 5,222 22% 35%
Non-interest revenue 2,500 2,151 7,131 16 (70)
Revenues, net of interest expense $11,118 $ 9,218 $12,353 21% (25)%
Operating expenses 11,051 10,864 8,778 224
Provisions for loan losses and for benefits and claims 3,572 1,818 770 96 NM
Income (loss) before taxes and minority interest $ (3,505) $ (3,464) $ 2,805 (1)% NM
Income taxes (1,847) (1,836) 604 (1) NM
Minority interest, net of taxes 83 85 42 (2) NM
Net income (loss) $ (1,741) $ (1,713) $ 2,159 (2)% NM
Average assets (in billions of dollars) $ 373 $ 406 $ 290 (8)% 40%
Return on assets (0.47)% (0.42)% 0.74% NM NM
Key indicators (in billions of dollars, except in branches)
Average loans $ 115.5 $ 117.5 $ 87.2 (2)% 35%
Average Consumer Banking loans 24.5 22.2 16.1 10 38
Average deposits (and other consumer liability balances) 159.0 140.3 99.6 13 41
Branches/offices 778 801 800 (3) —
NM Not meaningful.
2008 vs. 2007
Revenues increased 21% largely driven by Securities and Banking and
Transaction Services. In Global Cards, revenues increased by 19% to $2.3
billion, driven by higher purchase sales and average loans. Consumer
Banking revenues were up 4% to $2.6 billion as growth in average loans
was partially offset by impairment of the U.K. held-for-sale loan portfolio
and softening wealth management revenues due to market volatility.
Current and historical Germany retail banking financials have been
reclassified as discontinued operations and are excluded from Global Cards
and Consumer Banking results.
In ICG, S&B revenues were up 53% from 2007 mainly due to write-downs
on subprime-related direct exposures included in 2009. Subprime-related
direct exposures are now managed primarily in North America and have
been transferred from EMEA to North America with effect from the second
quarter of 2008. 2008 also included write-downs on subprime-related
exposures in the first quarter of 2008 and in commercial real estate
positions and highly leveraged finance commitments. Revenues also
reflected strong results in local markets sales and trading and G10 Rates
and Currencies. Transaction Services revenues increased 21% to $3.4 billion
with continued growth in customer liability balances and deposits.
Revenues in GWM grew by 11% to $0.6 billion primarily driven by an
increase in Banking, Capital Markets and Lending products.
Operating expenses were up 2% due to a $203 million goodwill
impairment charge and the impact of further repositioning and
restructuring charges in 2008. Partially offsetting the increase was a decline
in incentive compensation and the benefits of reengineering efforts.
Provisions for loan losses and for benefits and claims increased 96%.
The increase was primarily driven by the deterioration in the Consumer and
Corporate credit environment, higher loan loss reserve builds and losses
associated with Corporate loan sales.
2007 vs. 2006
Revenues were down 25% due to write-downs in Securities and Banking,
partially offset by double-digit growth across all other segments.
Global Cards revenues increased by 62% to $2.0 billion, driven by
double-digit growth in purchase sales and average loans and the impact of
the Egg acquisition. Revenues in Consumer Banking increased by 21% to
$2.5 billion, driven by strong growth in average loans and deposits and
improved net interest margin and the impact of the Egg acquisition.
S&B revenue of $1.5 billion was down from the prior year due to write-
downs on subprime-related direct exposures and in funded and unfunded
highly-leveraged loan commitments in the second half of 2007. Revenues
in S&B also included a strong performance in Equities, Advisory and local
markets sales and trading. Transaction Services revenues increased by 30%
to $2.8 billion driven by increased customer volumes and deposit growth.
Revenues in GWM grew by 64% to $0.5 billion primarily driven by an
increase in annuity revenues and the impact of the acquisition of Quilter.
Operating expenses were up 24% due to the impact of business growth,
acquisitions, FX translation and organizational and repositioning charges
in 2007.
Provisions for loan losses and for benefits and claims increased $1.0
billion primarily due to an increase in net credit losses and an incremental
net charge to loan loss reserves.
40