Citibank 2008 Annual Report Download - page 88
Download and view the complete annual report
Please find page 88 of the 2008 Citibank annual report below. You can navigate through the pages in the report by either clicking on the pages listed below, or by using the keyword search tool below to find specific information within the annual report.-
 1
1 -
2
-
3
-
4
-
5
-
6
-
7
-
8
-
9
-
10
-
11
-
12
-
13
-
14
-
15
-
16
-
17
-
18
-
19
-
20
-
21
-
22
-
23
-
24
-
25
-
26
-
27
-
28
-
29
-
30
-
31
-
32
-
33
-
34
-
35
-
36
-
37
-
38
-
39
-
40
-
41
-
42
-
43
-
44
-
45
-
46
-
47
-
48
-
49
-
50
-
51
-
52
-
53
-
54
-
55
-
56
-
57
-
58
-
59
-
60
-
61
-
62
-
63
-
64
-
65
-
66
-
67
-
68
-
69
-
70
-
71
-
72
-
73
-
74
-
75
-
76
-
77
-
 78
78 -
 79
79 -
 80
80 -
 81
81 -
 82
82 -
 83
83 -
 84
84 -
 85
85 -
 86
86 -
 87
87 -
 88
88 -
 89
89 -
 90
90 -
 91
91 -
 92
92 -
 93
93 -
 94
94 -
 95
95 -
 96
96 -
 97
97 -
 98
98 -
99
-
100
-
101
-
102
-
103
-
104
-
105
-
106
-
107
-
108
-
109
-
110
-
111
-
112
-
113
-
114
-
115
-
116
-
117
-
118
-
119
-
120
-
121
-
122
-
123
-
124
-
125
-
126
-
127
-
128
-
129
-
130
-
131
-
132
-
133
-
134
-
135
-
136
-
137
-
138
-
139
-
140
-
141
-
142
-
143
-
144
-
145
-
146
-
147
-
148
-
149
-
150
-
151
-
152
-
153
-
154
-
155
-
156
-
157
-
158
-
159
-
160
-
161
-
162
-
163
-
164
-
165
-
166
-
167
-
168
-
169
-
170
-
171
-
172
-
173
-
174
-
175
-
176
-
177
-
178
-
179
-
180
-
181
-
182
-
183
-
184
-
185
-
186
-
187
-
188
-
189
-
190
-
191
-
192
-
193
-
194
-
195
-
196
-
197
-
198
-
199
-
200
-
201
-
202
-
203
-
204
-
205
-
206
-
207
-
208
-
209
-
210
-
211
-
212
-
213
-
214
-
215
-
216
-
217
-
218
-
219
-
220
-
221
-
222
-
223
-
224
-
225
-
226
-
227
-
228
-
229
-
230
-
231
-
232
-
233
-
234
-
235
-
236
-
237
-
238
-
239
-
240
-
241
-
242
-
243
-
244
-
245
-
246
-
247
-
248
-
249
-
250
-
251
-
252
 |
 |
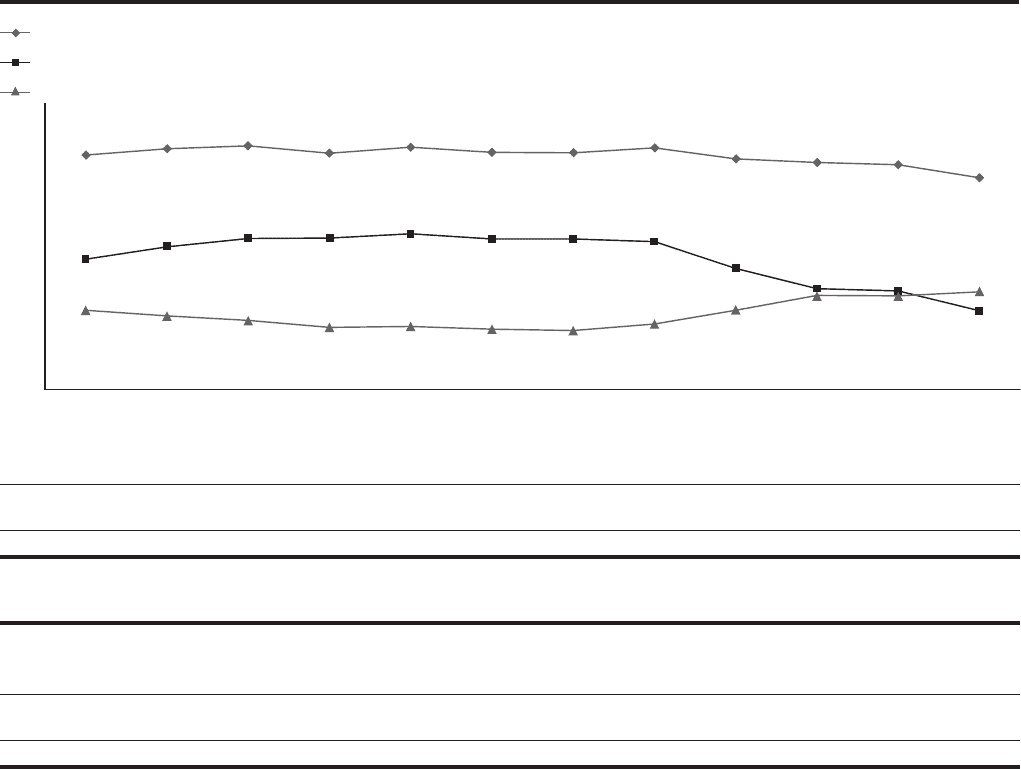
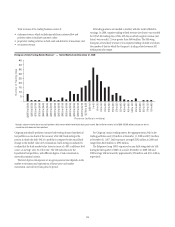
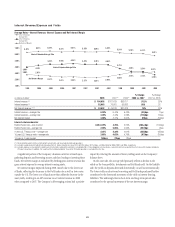
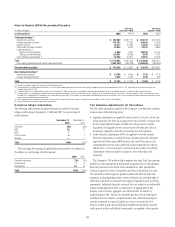
Interest Revenue/Expense and Yields
Average Rates
-
Interest Revenue, Interest Expense and Net Interest Margin
Interest Revenue-
Average Rate
Interest Expense-
Average Rate
Net Interest Margin
1Q06 2Q06 3Q06 4Q06 1Q07 2Q07 3Q07 4Q083Q082Q081Q084Q07
6.33% 6.47% 6.54% 6.37% 6.51% 6.39% 6.38% 6.49% 6.24% 6.16% 6.11% 5.81%
4.43% 4.44% 4.54% 4.42%4.42% 4.36%
3.75%
3.29% 3.24%
2.57% 2.41% 2.43% 2.37% 2.34% 2.49% 2.80%
3.14% 3.13% 2.79%
4.24%
3.96% 3.22%
2.67%
2.80%
1.00%
2.00%
3.00%
4.00%
5.00%
6.00%
7.00%
Interest Revenue-Average Rate
Net Interest Margin
Interest Expense-Average Rate
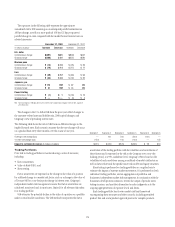
In millions of dollars 2008 2007 (1) 2006 (1)
% Change
2008 vs. 2007
% Change
2007 vs. 2006
Interest revenue (2) $ 106,655 $121,429 $93,611 (12)% 30%
Interest expense (3) 52,963 76,051 55,683 (30) 37
Net interest revenue (2) (3) $ 53,692 $ 45,378 $37,928 18% 20%
Interest revenue—average rate 6.09% 6.44% 6.43% (35)bps 1bps
Interest expense—average rate 3.28% 4.44% 4.28% (116)bps 16bps
Net interest margin 3.06% 2.41% 2.60% 65bps (19)bps
Interest-rate benchmarks:
Federal Funds rate—end of period 0.00–0.25% 4.25% 5.25% (400+)bps (100)bps
Federal Funds rate—average rate 2.08% 5.05% 4.96% (297)bps 9bps
2-year U.S. Treasury note—average rate 2.01% 4.36% 4.81% (235)bps (45)bps
10-year U.S. Treasury note—average rate 3.66% 4.63% 4.79% (97)bps (16)bps
10-year vs. 2-year spread 165bps 27bps (2)bps
(1) Reclassified to conform to the current period’s presentation and to exclude discontinued operations.
(2) Excludes taxable equivalent adjustments (based on the U.S. federal statutory tax rate of 35%) of $323 million, $125 million, and $98 million for 2008, 2007, and 2006, respectively.
(3) Excludes expenses associated with hybrid financial instruments and beneficial interest in consolidated VIEs. These obligations are classifiedasLong-term debt and accounted for at fair value with changes recorded in
Principal transactions. In addition, the majority of the funding provided by Treasury to CitiCapital operations is excluded from this line.
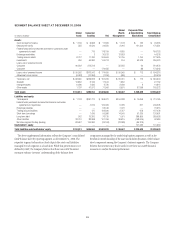
A significant portion of the Company’s business activities is based upon
gathering deposits and borrowing money and then lending or investing those
funds. Net interest margin is calculated by dividing gross interest revenue less
gross interest expense by average interest earning assets.
Net interest margin improved during 2008, mainly due to the lower cost
of funds, reflecting the decreases in the Fed Funds rate as well as lower rates
outside the U.S. The lower cost of funds more than offset the decrease in the
asset yields, resulting in an 18% increase in net interest revenue in 2008
when compared to 2007. The Company’s deleveraging actions had a positive
impact by reducing the amount of lower yielding assets on the Company’s
balance sheet.
On the asset side, the average yield primarily reflects a decline in the
yields on the loan portfolio, Investments and Fed Funds sold. On the liability
side, the yields on deposits decreased domestically, as well as internationally.
The lower yields on short-term borrowing and Fed Funds purchased further
contributed to the downward movement of the yield on interest-bearing
liabilities. The widening between short-term and long-term spreads also
contributed to the upward movement of the net interest margin.
82