Citibank 2008 Annual Report Download - page 174
Download and view the complete annual report
Please find page 174 of the 2008 Citibank annual report below. You can navigate through the pages in the report by either clicking on the pages listed below, or by using the keyword search tool below to find specific information within the annual report.-
 1
1 -
2
-
3
-
4
-
5
-
6
-
7
-
8
-
9
-
10
-
11
-
12
-
13
-
14
-
15
-
16
-
17
-
18
-
19
-
20
-
21
-
22
-
23
-
24
-
25
-
26
-
27
-
28
-
29
-
30
-
31
-
32
-
33
-
34
-
35
-
36
-
37
-
38
-
39
-
40
-
41
-
42
-
43
-
44
-
45
-
46
-
47
-
48
-
49
-
50
-
51
-
52
-
53
-
54
-
55
-
56
-
57
-
58
-
59
-
60
-
61
-
62
-
63
-
64
-
65
-
66
-
67
-
68
-
69
-
70
-
71
-
72
-
73
-
74
-
75
-
76
-
77
-
78
-
79
-
80
-
81
-
82
-
83
-
84
-
85
-
86
-
87
-
88
-
89
-
90
-
91
-
92
-
93
-
94
-
95
-
96
-
97
-
98
-
99
-
100
-
101
-
102
-
103
-
104
-
105
-
106
-
107
-
108
-
109
-
110
-
111
-
112
-
113
-
114
-
115
-
116
-
117
-
118
-
119
-
120
-
121
-
122
-
123
-
124
-
125
-
126
-
127
-
128
-
129
-
130
-
131
-
132
-
133
-
134
-
135
-
136
-
137
-
138
-
139
-
140
-
141
-
142
-
143
-
144
-
145
-
146
-
147
-
148
-
149
-
150
-
151
-
152
-
153
-
154
-
155
-
156
-
157
-
158
-
159
-
160
-
161
-
162
-
163
-
 164
164 -
 165
165 -
 166
166 -
 167
167 -
 168
168 -
 169
169 -
 170
170 -
 171
171 -
 172
172 -
 173
173 -
 174
174 -
 175
175 -
 176
176 -
 177
177 -
 178
178 -
 179
179 -
 180
180 -
 181
181 -
 182
182 -
 183
183 -
 184
184 -
185
-
186
-
187
-
188
-
189
-
190
-
191
-
192
-
193
-
194
-
195
-
196
-
197
-
198
-
199
-
200
-
201
-
202
-
203
-
204
-
205
-
206
-
207
-
208
-
209
-
210
-
211
-
212
-
213
-
214
-
215
-
216
-
217
-
218
-
219
-
220
-
221
-
222
-
223
-
224
-
225
-
226
-
227
-
228
-
229
-
230
-
231
-
232
-
233
-
234
-
235
-
236
-
237
-
238
-
239
-
240
-
241
-
242
-
243
-
244
-
245
-
246
-
247
-
248
-
249
-
250
-
251
-
252
 |
 |
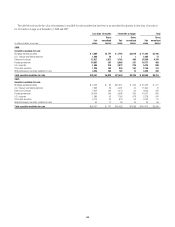
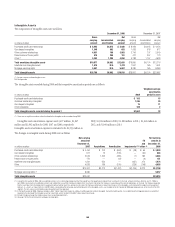
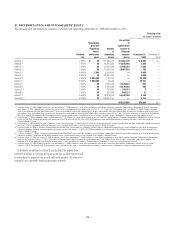
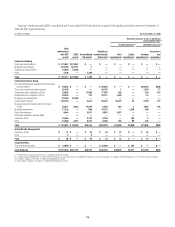
Intangible Assets
The components of intangible assets were as follows:
December 31, 2008 December 31, 2007
In millions of dollars
Gross
carrying
amount
Accumulated
amortization
Net
carrying
amount
Gross
carrying
amount
Accumulated
amortization
Net
carrying
amount
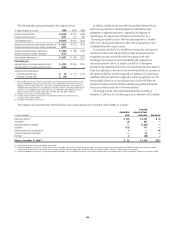
Purchased credit card relationships $ 8,443 $4,513 $ 3,930 $ 8,499 $4,045 $ 4,454
Core deposit intangibles 1,345 662 683 1,435 518 917
Other customer relationships 4,031 168 3,863 2,746 197 2,549
Present value of future profits 415 264 151 427 257 170
Other (1) 5,343 1,285 4,058 5,783 1,157 4,626
Total amortizing intangible assets $19,577 $6,892 $12,685 $18,890 $6,174 $12,716
Indefinite-lived intangible assets 1,474 N/A 1,474 1,591 N/A 1,591
Mortgage servicing rights 5,657 N/A 5,657 8,380 N/A 8,380
Total intangible assets $26,708 $6,892 $19,816 $28,861 $6,174 $22,687
(1) Includes contract-related intangible assets.
N/A Not Applicable.
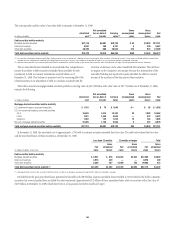
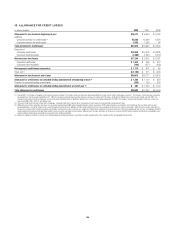
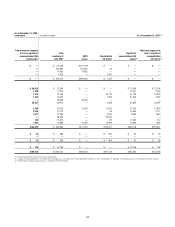
The intangible assets recorded during 2008 and their respective amortization periods are as follows:
In millions of dollars 2008
Weighted-average
amortization
period in years
Purchased credit card relationships $ 103 15
Customer relationship intangibles 1,355 25
Core deposit intangibles 15 11
Other intangibles 189 2
Total intangible assets recorded during the period (1) $1,662 22
(1) There was no significant residual value estimated for the intangible assets recorded during 2007.
Intangible assets amortization expense was $1,427 million, $1,267
million and $1,842 million for 2008, 2007 and 2006, respectively.
Intangible assets amortization expense is estimated to be $1,253 million in
2009, $1,224 million in 2010, $1,188 million in 2011, $1,162 million in
2012, and $1,044 million in 2013.
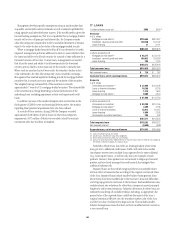
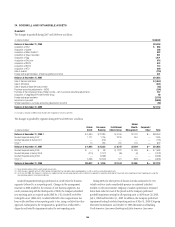
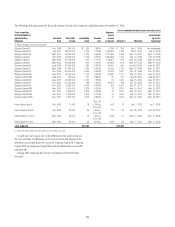
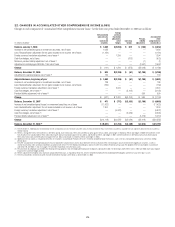
The changes in intangible assets during 2008 were as follows:
In millions of dollars
Net carrying
amount at
December 31,
2007 Acquisitions Amortization Impairments (1)(2)
FX
and
other (3)
Net carrying
amount at
December 31,
2008
Purchased credit card relationships $ 4,454 $ 103 $ (664) $ (28) $ 65 $ 3,930
Core deposit intangibles 917 15 (155) — (94) 683
Other customer relationships 2,549 1,355 (225) (1) 185 3,863
Present value of future profits 170 — (13) — (6) 151
Indefinite-lived intangible assets 1,591 550 — (937) 270 1,474
Other 4,626 189 (370) (239) (148) 4,058
$14,307 $2,212 $(1,427) $(1,205) $ 272 $14,159
Mortgage servicing rights (4) 8,380 5,657
Total intangible assets $22,687 $19,816
(1) During the first quarter of 2008, Old Lane notified investors in its multistrategy hedge fund that they would have the opportunity to redeem their investments in the fund, without restriction, effective July 31, 2008. In
April 2008, substantially all unaffiliated investors had notified Old Lane of their intention to redeem their investments. Based on the Company’s expectation of the level of redemptions in the fund, the Company expected
that the cash flows from the hedge fund management contract will be lower than previously estimated. The Company performed an impairment analysis of the intangible asset relating to the hedge fund management
contract. As a result, an impairment loss of $202 million, representing the remaining unamortized balance of the intangible assets, was recorded in the first quarter of 2008 operating expenses in the results of the ICG
segment. The fair value was estimated using a discounted cash flow approach.
(2) In the fourth quarter of 2008, Citigroup recorded a $937 million impairment charge on a Nikko Asset Management contract intangible. During the fourth quarter, it was determined that triggering events occurred that
required further testing of the intangible assets for impairment, which resulted in the $937 million impairment charge.
(3) Includes foreign exchange translation and purchase accounting adjustments.
(4) See page 182 for the roll-forward of mortgage servicing rights.
168