Citibank 2008 Annual Report Download - page 86
Download and view the complete annual report
Please find page 86 of the 2008 Citibank annual report below. You can navigate through the pages in the report by either clicking on the pages listed below, or by using the keyword search tool below to find specific information within the annual report.-
 1
1 -
2
-
3
-
4
-
5
-
6
-
7
-
8
-
9
-
10
-
11
-
12
-
13
-
14
-
15
-
16
-
17
-
18
-
19
-
20
-
21
-
22
-
23
-
24
-
25
-
26
-
27
-
28
-
29
-
30
-
31
-
32
-
33
-
34
-
35
-
36
-
37
-
38
-
39
-
40
-
41
-
42
-
43
-
44
-
45
-
46
-
47
-
48
-
49
-
50
-
51
-
52
-
53
-
54
-
55
-
56
-
57
-
58
-
59
-
60
-
61
-
62
-
63
-
64
-
65
-
66
-
67
-
68
-
69
-
70
-
71
-
72
-
73
-
74
-
75
-
 76
76 -
 77
77 -
 78
78 -
 79
79 -
 80
80 -
 81
81 -
 82
82 -
 83
83 -
 84
84 -
 85
85 -
 86
86 -
 87
87 -
 88
88 -
 89
89 -
 90
90 -
 91
91 -
 92
92 -
 93
93 -
 94
94 -
 95
95 -
 96
96 -
97
-
98
-
99
-
100
-
101
-
102
-
103
-
104
-
105
-
106
-
107
-
108
-
109
-
110
-
111
-
112
-
113
-
114
-
115
-
116
-
117
-
118
-
119
-
120
-
121
-
122
-
123
-
124
-
125
-
126
-
127
-
128
-
129
-
130
-
131
-
132
-
133
-
134
-
135
-
136
-
137
-
138
-
139
-
140
-
141
-
142
-
143
-
144
-
145
-
146
-
147
-
148
-
149
-
150
-
151
-
152
-
153
-
154
-
155
-
156
-
157
-
158
-
159
-
160
-
161
-
162
-
163
-
164
-
165
-
166
-
167
-
168
-
169
-
170
-
171
-
172
-
173
-
174
-
175
-
176
-
177
-
178
-
179
-
180
-
181
-
182
-
183
-
184
-
185
-
186
-
187
-
188
-
189
-
190
-
191
-
192
-
193
-
194
-
195
-
196
-
197
-
198
-
199
-
200
-
201
-
202
-
203
-
204
-
205
-
206
-
207
-
208
-
209
-
210
-
211
-
212
-
213
-
214
-
215
-
216
-
217
-
218
-
219
-
220
-
221
-
222
-
223
-
224
-
225
-
226
-
227
-
228
-
229
-
230
-
231
-
232
-
233
-
234
-
235
-
236
-
237
-
238
-
239
-
240
-
241
-
242
-
243
-
244
-
245
-
246
-
247
-
248
-
249
-
250
-
251
-
252
 |
 |
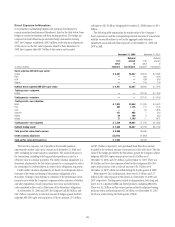
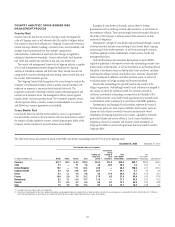
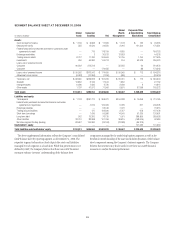
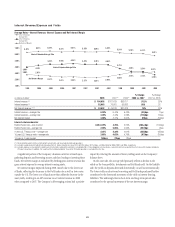
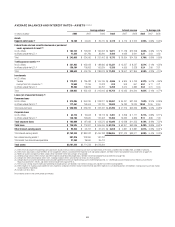
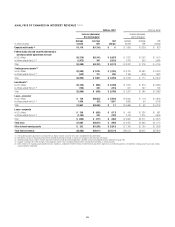
Deposits can be interest-bearing or non-interest-bearing. Interest-bearing
deposits payable by foreign and U.S. domestic banking subsidiaries of the
Company comprise 58% and 29% of total deposits, respectively, while
non-interest-bearing deposits comprise 5% and 8% of total deposits,
respectively.
During 2008 total deposits decreased by $52 billion, or 6%, primarily
due to:
• the sale of the German retail banking units; and
• lower international deposits, mostly driven by FX and the higher
funding costs which led to customers using their excess cash reserves
deposited with Citi.
Average deposits increased $5 billion to $695 billion in 2008, yielding an
average rate of 2.9%, compared to 4.1% in the prior year.
For more information on deposits, see “Capital Resources and Liquidity”
on page 94.
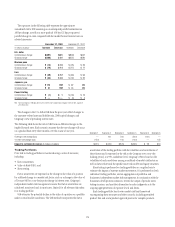
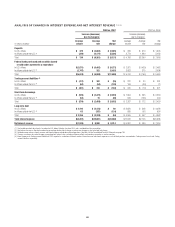
Debt
Debt is composed of both short-term and long-term borrowings. It includes
commercial paper, borrowings from unaffiliated banks, senior notes
(including collateralized advances from the Federal Home Loan Bank),
subordinated notes and trust preferred securities. The majority of debt is
carried at cost, with approximately $45 billion recorded at fair value in
accordance with SFAS 155 and SFAS 159.
During 2008, total debt decreased by $88 billion, or 15%, with short-term
borrowings decreasing by $20 billion, or 14%, and long-term debt decreasing
by $68 billion, or 16%.
The decrease in short-term borrowings was due to a decline of $12 billion
in other funds borrowed and $8 billion in commercial paper primarily due to
illiquid credit markets.
Average commercial paper outstanding in 2008 was $34 billion and
yielded an average rate of 3.1%, compared to $45 billion and 5.2% in 2007.
Average other funds borrowed in 2008 were $87 billion, yielding an average
rate of 1.7%, compared to $95 billion and 2.8% in the prior year.
The decrease in long- and short-term debt is driven by decreased funding
needs, as well as the issuance of preferred stock during the year. As the
balance sheet has decreased in size, the funding needs of the Company have
decreased.
Average long-term debt outstanding during 2008 was $348 billion,
compared to $303 billion in 2007, yielding an average rate of 4.6% and
5.3%, respectively.
For more information on debt, see Note 20 to the Consolidated Financial
Statements on page 169 and “Capital Resources and Liquidity” on page 94.
80