Citibank 2008 Annual Report Download - page 146
Download and view the complete annual report
Please find page 146 of the 2008 Citibank annual report below. You can navigate through the pages in the report by either clicking on the pages listed below, or by using the keyword search tool below to find specific information within the annual report.-
 1
1 -
2
-
3
-
4
-
5
-
6
-
7
-
8
-
9
-
10
-
11
-
12
-
13
-
14
-
15
-
16
-
17
-
18
-
19
-
20
-
21
-
22
-
23
-
24
-
25
-
26
-
27
-
28
-
29
-
30
-
31
-
32
-
33
-
34
-
35
-
36
-
37
-
38
-
39
-
40
-
41
-
42
-
43
-
44
-
45
-
46
-
47
-
48
-
49
-
50
-
51
-
52
-
53
-
54
-
55
-
56
-
57
-
58
-
59
-
60
-
61
-
62
-
63
-
64
-
65
-
66
-
67
-
68
-
69
-
70
-
71
-
72
-
73
-
74
-
75
-
76
-
77
-
78
-
79
-
80
-
81
-
82
-
83
-
84
-
85
-
86
-
87
-
88
-
89
-
90
-
91
-
92
-
93
-
94
-
95
-
96
-
97
-
98
-
99
-
100
-
101
-
102
-
103
-
104
-
105
-
106
-
107
-
108
-
109
-
110
-
111
-
112
-
113
-
114
-
115
-
116
-
117
-
118
-
119
-
120
-
121
-
122
-
123
-
124
-
125
-
126
-
127
-
128
-
129
-
130
-
131
-
132
-
133
-
134
-
135
-
 136
136 -
 137
137 -
 138
138 -
 139
139 -
 140
140 -
 141
141 -
 142
142 -
 143
143 -
 144
144 -
 145
145 -
 146
146 -
 147
147 -
 148
148 -
 149
149 -
 150
150 -
 151
151 -
 152
152 -
 153
153 -
 154
154 -
 155
155 -
 156
156 -
157
-
158
-
159
-
160
-
161
-
162
-
163
-
164
-
165
-
166
-
167
-
168
-
169
-
170
-
171
-
172
-
173
-
174
-
175
-
176
-
177
-
178
-
179
-
180
-
181
-
182
-
183
-
184
-
185
-
186
-
187
-
188
-
189
-
190
-
191
-
192
-
193
-
194
-
195
-
196
-
197
-
198
-
199
-
200
-
201
-
202
-
203
-
204
-
205
-
206
-
207
-
208
-
209
-
210
-
211
-
212
-
213
-
214
-
215
-
216
-
217
-
218
-
219
-
220
-
221
-
222
-
223
-
224
-
225
-
226
-
227
-
228
-
229
-
230
-
231
-
232
-
233
-
234
-
235
-
236
-
237
-
238
-
239
-
240
-
241
-
242
-
243
-
244
-
245
-
246
-
247
-
248
-
249
-
250
-
251
-
252
 |
 |

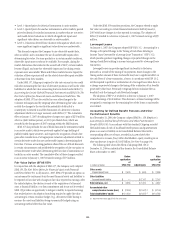
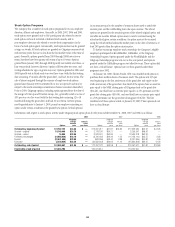
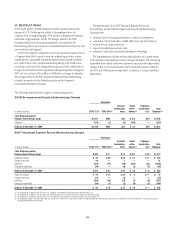
7. PRINCIPAL TRANSACTIONS
Principal transactions revenue consists of realized and unrealized gains and
losses from trading activities. Not included in the table below is the impact of
net interest revenue related to trading activities, which is an integral part of
trading activities’ profitability. The following table presents principal
transactions revenue for the years ended December 31:
In millions of dollars 2008 2007 2006 (1)
Institutional Clients Group
Fixed income (2) $ (6,455) $ 4,053 $5,593
Credit products (3) (21,614) (21,805) (744)
Equities (4) (394) 682 866
Foreign exchange (5) 2,316 1,222 693
Commodities (6) 667 686 487
Total ICG $(25,480) $(15,162) $6,895
Consumer Banking/Global Cards (7) 1,616 1,364 504
Global Wealth Management (7) 836 1,315 680
Corporate/Other 840 397 (89)
Total principal transactions revenue $(22,188) $(12,086) $7,990
(1) Reclassified to conform to the current period’s presentation.
(2) Includes revenues from government securities and corporate debt, municipal securities, preferred
stock, mortgage securities, and other debt instruments. Also includes spot and forward trading of
currencies and exchange-traded and over-the-counter (OTC) currency options, options on fixed income
securities, interest rate swaps, currency swaps, swap options, caps and floors, financial futures, OTC
options, and forward contracts on fixed income securities. Losses in 2008 reflect the volatility and
dislocation in the credit and trading markets.
(3) Includes revenues from structured credit products such as North America and Europe collateralized
debt obligations. In 2007 and 2008, losses recorded were related to subprime-related exposures in
ICG’s lending and structuring business and exposures to super senior CDOs.
(4) Includes revenues from common, preferred and convertible preferred stock, convertible corporate
debt, equity-linked notes, and exchange-traded and OTC equity options and warrants.
(5) Includes revenues from foreign exchange spot, forward, option and swap contracts, as well as
translation gains and losses.
(6) Primarily includes the results of Phibro LLC, which trades crude oil, refined oil products, natural gas,
and other commodities.
(7) Includes revenues from various fixed income, equities and foreign exchange transactions.
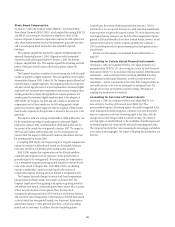
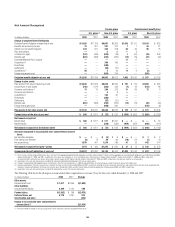
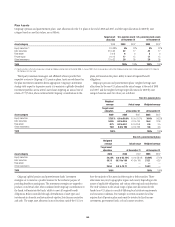
8. INCENTIVE PLANS
The Company has adopted a number of equity compensation plans under
which it administers stock options, restricted or deferred stock and stock
purchase programs. The award programs are used to attract, retain and
motivate officers, employees and non-employee directors, to compensate
them for their contributions to the Company, and to encourage employee
stock ownership. The plans are administered by the Personnel and
Compensation Committee of the Citigroup Board of Directors, which is
composed entirely of independent non-employee directors. At December 31,
2008, approximately 142 million shares were authorized and available for
grant under Citigroup’s stock incentive and stock purchase plans. In
accordance with Citigroup practice, shares would be issued out of Treasury
stock upon exercise or vesting.
The following table shows components of compensation expense relating
to the Company’s stock-based compensation programs as recorded during
2008, 2007 and 2006:
In millions of dollars 2008 2007 2006
SFAS 123(R) charges for January 2006 awards to
retirement-eligible employees $— $ — $ 648
SFAS 123(R) charges for estimated awards to
retirement-eligible employees 110 467 824
Option expense 29 86 129
Amortization of MC LTIP awards (1) 18 18 —
Amortization of restricted and deferred stock awards
(excluding MC LTIP) (2) 3,133 2,728 1,565
Total $3,290 $3,299 $3,166
(1) Management Committee Long-Term Incentive Plan (MC LTIP) was created in 2007.
(2) Represents amortization of expense over the remaining life of all unvested restricted and deferred
stock awards granted to all employees prior to 2006. The 2008, 2007 and 2006 periods also include
amortization expense for all unvested awards to non-retirement-eligible employees on or after
January 1, 2006. Amortization includes estimated forfeitures of awards.
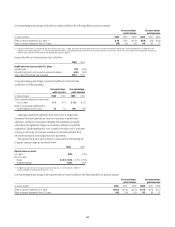
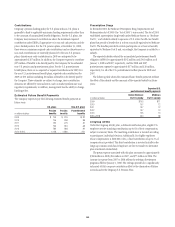
STOCK AWARD PROGRAMS
The Company, primarily through its Capital Accumulation Program (CAP),
issues shares of Citigroup common stock in the form of restricted or deferred
stock to participating officers and employees. For all stock award programs,
during the applicable vesting period, the shares awarded cannot be sold or
transferred by the participant, and some or all of the shares awarded are
subject to cancellation if the participant’s employment is terminated. After
the award vests, the shares become freely transferable (subject to the stock
ownership commitment of senior executives). From the date of the award,
the recipient of a restricted stock award can direct the vote of the shares and
receive dividend equivalents. Recipients of deferred stock awards receive
dividend equivalents, but cannot vote shares until they have vested.
Stock awards granted in January 2008, 2007, 2006 and 2005 generally
vest 25% per year over four years, except for awards to certain employees at
Smith Barney that vest after two years and July 2007 Management
Committee Long-Term Incentive Plan awards (further described below) that
vest in January 2010. Stock awards granted in 2003 and 2004 generally
vested after a two- or three-year vesting period. CAP participants in 2008,
2007, 2006 and 2005 could elect to receive all or part of their award in stock
options. The figures presented in the stock option program tables include
options granted under CAP. Unearned compensation expense associated with
the stock awards represents the market value of Citigroup common stock at
the date of grant and is recognized as a charge to income ratably over the
full vesting period, except for those awards granted to retirement-eligible
140