Citibank 2008 Annual Report Download - page 214
Download and view the complete annual report
Please find page 214 of the 2008 Citibank annual report below. You can navigate through the pages in the report by either clicking on the pages listed below, or by using the keyword search tool below to find specific information within the annual report.-
 1
1 -
2
-
3
-
4
-
5
-
6
-
7
-
8
-
9
-
10
-
11
-
12
-
13
-
14
-
15
-
16
-
17
-
18
-
19
-
20
-
21
-
22
-
23
-
24
-
25
-
26
-
27
-
28
-
29
-
30
-
31
-
32
-
33
-
34
-
35
-
36
-
37
-
38
-
39
-
40
-
41
-
42
-
43
-
44
-
45
-
46
-
47
-
48
-
49
-
50
-
51
-
52
-
53
-
54
-
55
-
56
-
57
-
58
-
59
-
60
-
61
-
62
-
63
-
64
-
65
-
66
-
67
-
68
-
69
-
70
-
71
-
72
-
73
-
74
-
75
-
76
-
77
-
78
-
79
-
80
-
81
-
82
-
83
-
84
-
85
-
86
-
87
-
88
-
89
-
90
-
91
-
92
-
93
-
94
-
95
-
96
-
97
-
98
-
99
-
100
-
101
-
102
-
103
-
104
-
105
-
106
-
107
-
108
-
109
-
110
-
111
-
112
-
113
-
114
-
115
-
116
-
117
-
118
-
119
-
120
-
121
-
122
-
123
-
124
-
125
-
126
-
127
-
128
-
129
-
130
-
131
-
132
-
133
-
134
-
135
-
136
-
137
-
138
-
139
-
140
-
141
-
142
-
143
-
144
-
145
-
146
-
147
-
148
-
149
-
150
-
151
-
152
-
153
-
154
-
155
-
156
-
157
-
158
-
159
-
160
-
161
-
162
-
163
-
164
-
165
-
166
-
167
-
168
-
169
-
170
-
171
-
172
-
173
-
174
-
175
-
176
-
177
-
178
-
179
-
180
-
181
-
182
-
183
-
184
-
185
-
186
-
187
-
188
-
189
-
190
-
191
-
192
-
193
-
194
-
195
-
196
-
197
-
198
-
199
-
200
-
201
-
202
-
203
-
 204
204 -
 205
205 -
 206
206 -
 207
207 -
 208
208 -
 209
209 -
 210
210 -
 211
211 -
 212
212 -
 213
213 -
 214
214 -
 215
215 -
 216
216 -
 217
217 -
 218
218 -
 219
219 -
 220
220 -
 221
221 -
 222
222 -
 223
223 -
 224
224 -
225
-
226
-
227
-
228
-
229
-
230
-
231
-
232
-
233
-
234
-
235
-
236
-
237
-
238
-
239
-
240
-
241
-
242
-
243
-
244
-
245
-
246
-
247
-
248
-
249
-
250
-
251
-
252
 |
 |

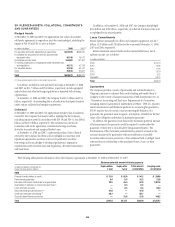
29. PLEDGED ASSETS, COLLATERAL, COMMITMENTS
AND GUARANTEES
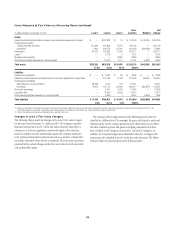
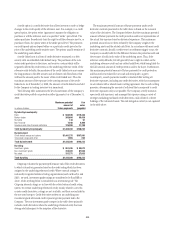
Pledged Assets
At December 31, 2008 and 2007, the approximate fair values of securities
sold under agreements to repurchase and other assets pledged, excluding the
impact of FIN 39 and FIN 41, were as follows:
In millions of dollars 2008 2007(1)
For securities sold under agreements to repurchase $237,055 $296,991
As collateral for securities borrowed for approximately
equivalent value 81,740 75,572
As collateral on bank loans 144,982 151,957
To clearing organizations or segregated under securities laws
and regulations 41,312 42,793
For securities loaned 51,158 94,161
Other 52,576 27,847
Total $608,823 $689,321
(1) Reclassified to conform to the current period’s presentation.
In addition, included in cash and due from banks at December 31, 2008
and 2007 are $11.7 billion and $9.6 billion, respectively, of cash segregated
under federal and other brokerage regulations or deposited with clearing
organizations.
At December 31, 2008 and 2007, the Company had $3.1 billion and $5.3
billion, respectively, of outstanding letters of credit from third-party banks to
satisfy various collateral and margin requirements.
Collateral
At December 31, 2008 and 2007, the approximate market value of collateral
received by the Company that may be sold or repledged by the Company,
excluding amounts netted in accordance with FIN 39 and FIN 41, was $340.2
billion and $405.0 billion, respectively. This collateral was received in
connection with resale agreements, securities borrowings and loans,
derivative transactions and margined broker loans.
At December 31, 2008 and 2007, a substantial portion of the collateral
received by the Company had been sold or repledged in connection with
repurchase agreements, securities sold, not yet purchased, securities
borrowings and loans, pledges to clearing organizations, segregation
requirements under securities laws and regulations, derivative transactions
and bank loans.
In addition, at December 31, 2008 and 2007, the Company had pledged
$236 billion and $196 billion, respectively, of collateral that may not be sold
or repledged by the secured parties.
Lease Commitments
Rental expense (principally for offices and computer equipment) was $2.7
billion, $2.3 billion and $1.9 billion for the years ended December 31, 2008,
2007 and 2006, respectively.
Future minimum annual rentals under noncancelable leases, net of
sublease income, are as follows:
In millions of dollars
2009 $1,470
2010 1,328
2011 1,134
2012 1,010
2013 922
Thereafter 3,415
Total $9,279
Guarantees
The Company provides a variety of guarantees and indemnifications to
Citigroup customers to enhance their credit standing and enable them to
complete a wide variety of business transactions. FASB Interpretation No. 45,
“Guarantor’s Accounting and Disclosure Requirements for Guarantees,
Including Indirect Guarantees of Indebtedness of Others” (FIN 45),provides
initial measurement and disclosure guidance in accounting for guarantees.
FIN 45 requires that, for certain contracts meeting the definition of a
guarantee, the guarantor must recognize, at inception, a liability for the fair
value of the obligation undertaken in issuing the guarantee.
In addition, the guarantor must disclose the maximum potential amount
of future payments the guarantor could be required to make under the
guarantee, if there were a total default by the guaranteed parties. The
determination of the maximum potential future payments is based on the
notional amount of the guarantees without consideration of possible
recoveries under recourse provisions or from collateral held or pledged. Such
amounts bear no relationship to the anticipated losses, if any, on these
guarantees.
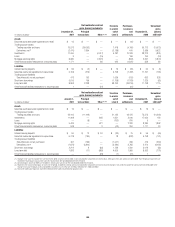
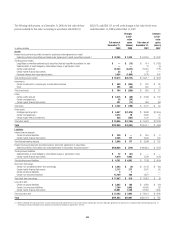
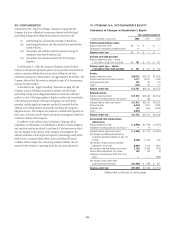
The following tables present information about the Company’s guarantees at December 31, 2008 and December 31, 2007:
Maximum potential amount of future payments
Carrying value
(in millions)
In billions of dollars at December 31,
except carrying value in millions
Expire within
1 year
Expire after
1 year
Total amount
outstanding
2008
Financial standby letters of credit $ 31.6 $ 62.6 $ 94.2 $ 289.0
Performance guarantees 9.4 6.9 16.3 23.6
Derivative instruments considered to be guarantees 22.5 45.4 67.9 1,301.5
Guarantees of collection of contractual cash flows (1) — 0.3 0.3 —
Loans sold with recourse — 0.3 0.3 56.4
Securities lending indemnifications (1) 47.6 — 47.6 —
Credit card merchant processing (1) 56.7 — 56.7 —
Custody indemnifications and other — 21.6 21.6 149.2
Total $167.8 $137.1 $304.9 $1,819.7
208