Citibank 2008 Annual Report Download - page 17
Download and view the complete annual report
Please find page 17 of the 2008 Citibank annual report below. You can navigate through the pages in the report by either clicking on the pages listed below, or by using the keyword search tool below to find specific information within the annual report.-
 1
1 -
2
-
3
-
4
-
5
-
6
-
 7
7 -
 8
8 -
 9
9 -
 10
10 -
 11
11 -
 12
12 -
 13
13 -
 14
14 -
 15
15 -
 16
16 -
 17
17 -
 18
18 -
 19
19 -
 20
20 -
 21
21 -
 22
22 -
 23
23 -
 24
24 -
 25
25 -
 26
26 -
 27
27 -
28
-
29
-
30
-
31
-
32
-
33
-
34
-
35
-
36
-
37
-
38
-
39
-
40
-
41
-
42
-
43
-
44
-
45
-
46
-
47
-
48
-
49
-
50
-
51
-
52
-
53
-
54
-
55
-
56
-
57
-
58
-
59
-
60
-
61
-
62
-
63
-
64
-
65
-
66
-
67
-
68
-
69
-
70
-
71
-
72
-
73
-
74
-
75
-
76
-
77
-
78
-
79
-
80
-
81
-
82
-
83
-
84
-
85
-
86
-
87
-
88
-
89
-
90
-
91
-
92
-
93
-
94
-
95
-
96
-
97
-
98
-
99
-
100
-
101
-
102
-
103
-
104
-
105
-
106
-
107
-
108
-
109
-
110
-
111
-
112
-
113
-
114
-
115
-
116
-
117
-
118
-
119
-
120
-
121
-
122
-
123
-
124
-
125
-
126
-
127
-
128
-
129
-
130
-
131
-
132
-
133
-
134
-
135
-
136
-
137
-
138
-
139
-
140
-
141
-
142
-
143
-
144
-
145
-
146
-
147
-
148
-
149
-
150
-
151
-
152
-
153
-
154
-
155
-
156
-
157
-
158
-
159
-
160
-
161
-
162
-
163
-
164
-
165
-
166
-
167
-
168
-
169
-
170
-
171
-
172
-
173
-
174
-
175
-
176
-
177
-
178
-
179
-
180
-
181
-
182
-
183
-
184
-
185
-
186
-
187
-
188
-
189
-
190
-
191
-
192
-
193
-
194
-
195
-
196
-
197
-
198
-
199
-
200
-
201
-
202
-
203
-
204
-
205
-
206
-
207
-
208
-
209
-
210
-
211
-
212
-
213
-
214
-
215
-
216
-
217
-
218
-
219
-
220
-
221
-
222
-
223
-
224
-
225
-
226
-
227
-
228
-
229
-
230
-
231
-
232
-
233
-
234
-
235
-
236
-
237
-
238
-
239
-
240
-
241
-
242
-
243
-
244
-
245
-
246
-
247
-
248
-
249
-
250
-
251
-
252
 |
 |
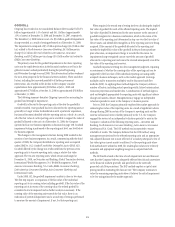
Commercial Real Estate
S&B’s commercial real estate exposure is split into three categories: assets
held at fair value; held to maturity/held for investment; and equity. During
2008, pretax losses of $2.6 billion net of hedges were booked on exposures
recorded at fair value. See “Exposure to Commercial Real Estate” on page 69
for a further discussion.
Structured Investment Vehicles (SIVs)
On December 13, 2007, Citigroup announced a commitment to provide
support facilities to its Citi-advised SIVs for the purpose of resolving the
uncertainty regarding the SIVs’ senior debt ratings. As a result of this
commitment, the Company consolidated the SIVs’ assets and liabilities onto
Citigroup’s Consolidated Balance Sheet as of December 2007. This resulted
in an increase of assets of $59 billion.
On February 12, 2008, Citigroup finalized the terms of these support
facilities, which took the form of a commitment to provide $3.5 billion of
mezzanine capital to the SIVs. The mezzanine capital facility was increased
by $1.0 billion to $4.5 billion, with the additional commitment funded
during the fourth quarter of 2008. During the period to November 18, 2008,
Citigroup recorded $3.3 billion of trading account losses on SIV assets.
To complete the wind-down of the SIVs, Citigroup committed to purchase
all remaining assets out of the SIV legal vehicles at fair value, with a trade
date of November 18, 2008. Citigroup funded the purchase of the assets by
assuming the obligation to pay amounts due under the medium-term notes
issued by the SIVs as the notes mature. The assets purchased from the SIVs
and the liabilities assumed by the Company were previously recognized at
fair value on the Company’s balance sheet due to the consolidation of the
SIV legal vehicles in December 2007.
The net cash funding provided by Citigroup for the asset purchase was
$0.3 billion. As of December 31, 2008, the balance for these repurchased SIV
assets totaled $16.6 billion, of which $16.5 billion is classified as held to
maturity. See “Structured Investment Vehicles” on page 15 for a further
discussion.
Credit Valuation Adjustment on Citi’s Liabilities for
Which Citi Has Elected the Fair Value Option
Under SFAS 157, the Company is required to use its own-credit spreads in
determining the current value for its derivative liabilities and all other
liabilities for which it has elected the fair value option. When Citi’s credit
spreads widen (deteriorate), Citi recognizes a gain on these liabilities
because the value of the liabilities has decreased. When Citi’s credit spreads
narrow (improve), Citi recognizes a loss on these liabilities because the value
of the liabilities has increased.
During 2008, the Company recorded a gain of approximately $4.6 billion
on its fair value option liabilities due to the widening of the Company’s credit
spreads. $2.49 billion of this gain was due to a change in methodology for
estimating the credit valuation adjustment implemented in the fourth
quarter. As of December 31, 2008, the Company estimates the market value
of the liabilities by incorporating the Company’s credit spreads observed in
the bond market (cash spreads). Prior to that date, the Company
incorporated the Company’s credit default swaps spreads in the valuation of
these liabilities. For further discussion regarding this change, see
“Significant Accounting Policies and Significant Estimates” on page 18.
CREDIT RESERVES
During 2008, the Company recorded a net build of $14.3 billion to its credit
reserves. The build consisted of $10.8 billion in Consumer ($8.2 billion in
North America and $2.6 billion in regions outside of North America), $3.3
billion in ICG and $249 million in GWM.
The $8.2 billion build in North America Consumer included additional
reserves for the increased number of loan modification adjustments to
customer loans across all product lines. The higher credit costs primarily
reflected a weakening of leading credit indicators, including higher
delinquencies on first and second mortgages, unsecured personal loans,
credit cards and auto loans. Reserves also increased due to trends in the U.S.
macroeconomic environment, including the housing market downturn and
rising unemployment rates.
The $2.6 billion build in regions outside of North America was primarily
driven by deterioration in Mexico, Brazil, the U.K., Spain, Greece and India.
The build of $3.3 billion in ICG primarily reflects a weakening in overall
portfolio credit quality, as well as loan loss reserves for specific
counterparties.
As the environment for consumer credit continues to deteriorate, the
Company has taken additional actions to manage risks, such as tightening
underwriting criteria and selectively reducing credit lines. However, credit
losses are expected to rise through 2009 and it is likely that the Company’s
loss rates may exceed their historical peaks.
The total allowance for loan losses and unfunded lending commitments
totaled $30.5 billion at December 31, 2008.
GOODWILL
Based on the results of goodwill impairment testing as of December 31, 2008,
Citigroup recorded a pretax charge of approximately $9.6 billion ($8.7
billion after tax) in the fourth quarter of 2008 for goodwill impairments
related to its North America Consumer Banking,Latin America
Consumer Banking and EMEA Consumer Banking reporting units. This
charge resulted in the write-off of the entire amount of goodwill allocated to
those reporting units. However, this charge did not result in a cash outflow or
negatively affect Tier 1 and Total Regulatory Capital Ratios, Tangible Capital
or the Company’s liquidity position.
The primary cause for the goodwill impairment in the above reporting
units was the rapid deterioration in the financial markets as well as in the
global economic outlook particularly during the period beginning mid-
November and through year end December 2008. This deterioration further
weakened the near-term prospects for the financial services industry. These
and other factors, including the increased possibility of further government
intervention, also resulted in the decline in the Company’s market
capitalization from approximately $90 billion at July 1, 2008 and
approximately $74 billion at October 31, 2008 to approximately $36 billion
at December 31, 2008. See “Significant Accounting Policies and Significant
Estimates” on page 18 for a further discussion of goodwill.
11