Citibank 2008 Annual Report Download - page 190
Download and view the complete annual report
Please find page 190 of the 2008 Citibank annual report below. You can navigate through the pages in the report by either clicking on the pages listed below, or by using the keyword search tool below to find specific information within the annual report.-
 1
1 -
2
-
3
-
4
-
5
-
6
-
7
-
8
-
9
-
10
-
11
-
12
-
13
-
14
-
15
-
16
-
17
-
18
-
19
-
20
-
21
-
22
-
23
-
24
-
25
-
26
-
27
-
28
-
29
-
30
-
31
-
32
-
33
-
34
-
35
-
36
-
37
-
38
-
39
-
40
-
41
-
42
-
43
-
44
-
45
-
46
-
47
-
48
-
49
-
50
-
51
-
52
-
53
-
54
-
55
-
56
-
57
-
58
-
59
-
60
-
61
-
62
-
63
-
64
-
65
-
66
-
67
-
68
-
69
-
70
-
71
-
72
-
73
-
74
-
75
-
76
-
77
-
78
-
79
-
80
-
81
-
82
-
83
-
84
-
85
-
86
-
87
-
88
-
89
-
90
-
91
-
92
-
93
-
94
-
95
-
96
-
97
-
98
-
99
-
100
-
101
-
102
-
103
-
104
-
105
-
106
-
107
-
108
-
109
-
110
-
111
-
112
-
113
-
114
-
115
-
116
-
117
-
118
-
119
-
120
-
121
-
122
-
123
-
124
-
125
-
126
-
127
-
128
-
129
-
130
-
131
-
132
-
133
-
134
-
135
-
136
-
137
-
138
-
139
-
140
-
141
-
142
-
143
-
144
-
145
-
146
-
147
-
148
-
149
-
150
-
151
-
152
-
153
-
154
-
155
-
156
-
157
-
158
-
159
-
160
-
161
-
162
-
163
-
164
-
165
-
166
-
167
-
168
-
169
-
170
-
171
-
172
-
173
-
174
-
175
-
176
-
177
-
178
-
179
-
 180
180 -
 181
181 -
 182
182 -
 183
183 -
 184
184 -
 185
185 -
 186
186 -
 187
187 -
 188
188 -
 189
189 -
 190
190 -
 191
191 -
 192
192 -
 193
193 -
 194
194 -
 195
195 -
 196
196 -
 197
197 -
 198
198 -
 199
199 -
 200
200 -
201
-
202
-
203
-
204
-
205
-
206
-
207
-
208
-
209
-
210
-
211
-
212
-
213
-
214
-
215
-
216
-
217
-
218
-
219
-
220
-
221
-
222
-
223
-
224
-
225
-
226
-
227
-
228
-
229
-
230
-
231
-
232
-
233
-
234
-
235
-
236
-
237
-
238
-
239
-
240
-
241
-
242
-
243
-
244
-
245
-
246
-
247
-
248
-
249
-
250
-
251
-
252
 |
 |
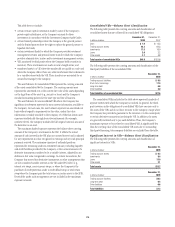
Finally, the Company is one of several named dealers in the commercial
paper issued by the conduits and earns a market-based fee for providing such
services. Along with third-party dealers, the Company makes a market in the
commercial paper and may from time to time fund commercial paper
pending sale to a third party. On specific dates with less liquidity in the
market, the Company may hold in inventory commercial paper issued by
conduits administered by the Company, as well as conduits administered by
third parties. The amount of commercial paper issued by its administered
conduits held in inventory fluctuates based on market conditions and
activity. As of December 31, 2008, the Company owned $57 million of
commercial paper issued by its administered conduits.
FIN 46(R) requires that the Company quantitatively analyze the expected
variability of the conduit to determine whether the Company is the primary
beneficiary of the conduit. The Company performs this analysis on a
quarterly basis and has concluded that the Company is not the primary
beneficiary of the conduits as defined in FIN 46(R) and, therefore, does not
consolidate the conduits it administers. In conducting this analysis, the
Company considers three primary sources of variability in the conduit: credit
risk, interest-rate risk and fee variability.
The Company models the credit risk of the conduit’s assets using a Credit
Value at Risk (C-VaR) model. The C-VaR model considers changes in credit
spreads (both within a rating class as well as due to rating upgrades and
downgrades), name-specific changes in credit spreads, credit defaults and
recovery rates and diversification effects of pools of financial assets. The
model incorporates data from independent rating agencies as well as the
Company’s own proprietary information regarding spread changes, ratings
transitions and losses given default. Using this credit data, a Monte Carlo
simulation is performed to develop a distribution of credit risk for the
portfolio of assets owned by each conduit, which is then applied on a
probability-weighted basis to determine expected losses due to credit risk. In
addition, the Company continuously monitors the specific credit
characteristics of the conduit’s assets and the current credit environment to
confirm that the C-VaR model used continues to incorporate the Company’s
best information regarding the expected credit risk of the conduit’s assets.
The Company also analyzes the variability in the fees that it earns from
the conduit using monthly actual historical cash flow data to determine
average fee and standard deviation measures for each conduit. Because any
unhedged interest rate and foreign-currency risk not contractually passed on
to customers is absorbed by the fees earned by the Company, the fee
variability analysis incorporates those risks.
The fee variability and credit risk variability are then combined into a
single distribution of the conduit’s overall returns. This return distribution is
updated and analyzed on at least a quarterly basis to ensure that the amount
of the Subordinate Loss Notes issued to third parties is sufficient to absorb
greater than 50% of the total expected variability in the conduit’s returns.
The expected variability absorbed by the Subordinate Loss Note investors is
therefore measured to be greater than the expected variability absorbed by
the Company through its liquidity arrangements and other fees earned, and
the investors in commercial paper and medium-term notes. While the
notional amounts of the Subordinate Loss Notes are quantitatively small
compared to the size of the conduits, this is reflective of the fact that most of
the substantive risks of the conduits are absorbed by the enhancements
provided by the sellers and other third parties that provide transaction-level
credit enhancement. Because FIN 46(R) requires these risks and related
enhancements to be excluded from the analysis, the remaining risks and
expected variability are quantitatively small. The calculation of variability
under FIN 46(R) focuses primarily on expected variability, rather than the
risks associated with extreme outcomes (for example, large levels of default)
that are expected to occur very infrequently. So while the Subordinate Loss
Notes are sized appropriately compared to expected losses as measured in FIN
46(R), they do not provide significant protection against extreme or unusual
credit losses.
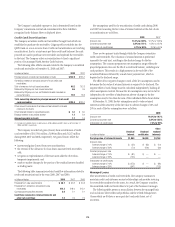
Third-Party Commercial Paper Conduits
The Company also provides liquidity facilities to single- and multi-seller
conduits sponsored by third parties. These conduits are independently owned
and managed and invest in a variety of asset classes, depending on the
nature of the conduit. The facilities provided by the Company typically
represent a small portion of the total liquidity facilities obtained by each
conduit, and are collateralized by the assets of each conduit. The notional
amount of these facilities is approximately $1.4 billion as of December 31,
2008. $2 million was funded under these facilities as of December 31, 2008.
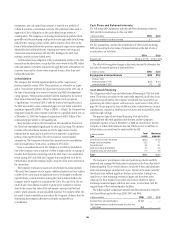
Collateralized Debt and Loan Obligations
A collateralized debt obligation (CDO) is an SPE that purchases a pool of
assets consisting of asset-backed securities and synthetic exposures through
derivatives on asset-backed securities and issues multiple tranches of equity
and notes to investors. A third-party manager is typically retained by the CDO
to select the pool of assets and manage those assets over the term of the CDO.
The Company earns fees for warehousing assets prior to the creation of a
CDO, structuring CDOs and placing debt securities with investors. In
addition, the Company has retained interests in many of the CDOs it has
structured and makes a market in those issued notes.
A cash CDO, or arbitrage CDO, is a CDO designed to take advantage of the
difference between the yield on a portfolio of selected assets, typically
residential mortgage-backed securities, and the cost of funding the CDO
through the sale of notes to investors. “Cash flow” CDOs are vehicles in
which the CDO passes on cash flows from a pool of assets, while “market
value” CDOs pay to investors the market value of the pool of assets owned by
the CDO at maturity. Both types of CDOs are typically managed by a third-
party asset manager. In these transactions, all of the equity and notes issued
by the CDO are funded, as the cash is needed to purchase the debt securities.
In a typical cash CDO, a third-party investment manager selects a portfolio
of assets, which the Company funds through a warehouse financing
arrangement prior to the creation of the CDO. The Company then sells the
debt securities to the CDO in exchange for cash raised through the issuance
of notes. The Company’s continuing involvement in cash CDOs is typically
limited to investing in a portion of the notes or loans issued by the CDO and
making a market in those securities, and acting as derivative counterparty
for interest rate or foreign currency swaps used in the structuring of the CDO.
A synthetic CDO is similar to a cash CDO, except that the CDO obtains
exposure to all or a portion of the referenced assets synthetically through
derivative instruments, such as credit default swaps. Because the CDO does
not need to raise cash sufficient to purchase the entire referenced portfolio, a
substantial portion of the senior tranches of risk is typically passed on to CDO
investors in the form of unfunded liabilities or derivative instruments. Thus,
the CDO writes credit protection on select referenced debt securities to the
Company or third parties and the risk is then passed on to the CDO investors
in the form of funded notes or purchased credit protection through derivative
184