Citibank 2008 Annual Report Download - page 225
Download and view the complete annual report
Please find page 225 of the 2008 Citibank annual report below. You can navigate through the pages in the report by either clicking on the pages listed below, or by using the keyword search tool below to find specific information within the annual report.-
 1
1 -
2
-
3
-
4
-
5
-
6
-
7
-
8
-
9
-
10
-
11
-
12
-
13
-
14
-
15
-
16
-
17
-
18
-
19
-
20
-
21
-
22
-
23
-
24
-
25
-
26
-
27
-
28
-
29
-
30
-
31
-
32
-
33
-
34
-
35
-
36
-
37
-
38
-
39
-
40
-
41
-
42
-
43
-
44
-
45
-
46
-
47
-
48
-
49
-
50
-
51
-
52
-
53
-
54
-
55
-
56
-
57
-
58
-
59
-
60
-
61
-
62
-
63
-
64
-
65
-
66
-
67
-
68
-
69
-
70
-
71
-
72
-
73
-
74
-
75
-
76
-
77
-
78
-
79
-
80
-
81
-
82
-
83
-
84
-
85
-
86
-
87
-
88
-
89
-
90
-
91
-
92
-
93
-
94
-
95
-
96
-
97
-
98
-
99
-
100
-
101
-
102
-
103
-
104
-
105
-
106
-
107
-
108
-
109
-
110
-
111
-
112
-
113
-
114
-
115
-
116
-
117
-
118
-
119
-
120
-
121
-
122
-
123
-
124
-
125
-
126
-
127
-
128
-
129
-
130
-
131
-
132
-
133
-
134
-
135
-
136
-
137
-
138
-
139
-
140
-
141
-
142
-
143
-
144
-
145
-
146
-
147
-
148
-
149
-
150
-
151
-
152
-
153
-
154
-
155
-
156
-
157
-
158
-
159
-
160
-
161
-
162
-
163
-
164
-
165
-
166
-
167
-
168
-
169
-
170
-
171
-
172
-
173
-
174
-
175
-
176
-
177
-
178
-
179
-
180
-
181
-
182
-
183
-
184
-
185
-
186
-
187
-
188
-
189
-
190
-
191
-
192
-
193
-
194
-
195
-
196
-
197
-
198
-
199
-
200
-
201
-
202
-
203
-
204
-
205
-
206
-
207
-
208
-
209
-
210
-
211
-
212
-
213
-
214
-
 215
215 -
 216
216 -
 217
217 -
 218
218 -
 219
219 -
 220
220 -
 221
221 -
 222
222 -
 223
223 -
 224
224 -
 225
225 -
 226
226 -
 227
227 -
 228
228 -
 229
229 -
 230
230 -
 231
231 -
 232
232 -
 233
233 -
 234
234 -
 235
235 -
236
-
237
-
238
-
239
-
240
-
241
-
242
-
243
-
244
-
245
-
246
-
247
-
248
-
249
-
250
-
251
-
252
 |
 |

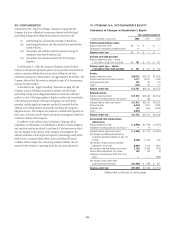
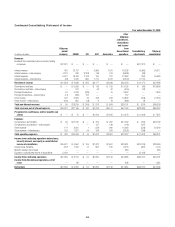
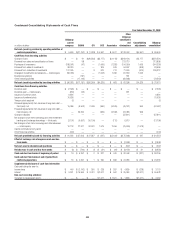
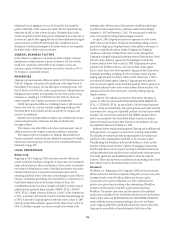
Condensed Consolidating Statement of Income
Year ended December 31, 2006
In millions of dollars
Citigroup
parent
company CGMHI CFI CCC Associates
Other
Citigroup
subsidiaries,
eliminations
and income
from
discontinued
operations
Consolidating
adjustments
Citigroup
consolidated
Revenues
Dividends from subsidiary banks and bank holding
companies $17,327 $ — $ — $ — $ — $ — $(17,327) $ —
Interest revenue 453 23,757 — 5,989 7,073 62,328 (5,989) 93,611
Interest revenue—intercompany 4,213 608 3,298 88 419 (8,538) (88) —
Interest expense 6,041 18,787 2,153 190 722 27,980 (190) 55,683
Interest expense—intercompany (53) 2,940 890 1,710 2,472 (6,249) (1,710) —
Net interest revenue $ (1,322) $ 2,638 $ 255 $4,177 $4,298 $32,059 $ (4,177) $37,928
Commissions and fees $ — $ 9,539 $ — $ 66 $ 156 $ 9,155 $ (66) $18,850
Commissions and fees—intercompany — 274 — 43 42 (316) (43) —
Principal transactions 44 4,319 (285) — 15 3,897 — 7,990
Principal transactions—intercompany (14) (295) 152 — — 157 — —
Other income 126 3,879 46 458 618 16,890 (458) 21,559
Other income—intercompany (120) 802 (18) 9 18 (682) (9) —
Total non-interest revenues $ 36 $18,518 $ (105) $ 576 $ 849 $29,101 $ (576) $48,399
Total revenues, net of interest expense $16,041 $21,156 $ 150 $4,753 $5,147 $61,160 $(22,080) $86,327
Provisions for credit losses and for benefits and
claims $ — $ 70 $ — $1,209 $1,395 $ 6,072 $ (1,209) $ 7,537
Expenses
Compensation and benefits $ 93 $11,240 $ — $ 759 $ 967 $17,452 $ (759) $29,752
Compensation and benefits—intercompany 7 1 — 137 138 (146) (137) —
Other expense 174 3,661 1 528 690 16,023 (528) 20,549
Other expense—intercompany 155 1,627 44 198 266 (2,092) (198) —
Total operating expenses $ 429 $16,529 $ 45 $1,622 $2,061 $31,237 $ (1,622) $50,301
Income from continuing operations before taxes,
minority interest, and equity in undistributed
income of subsidiaries $15,612 $ 4,557 $ 105 $1,922 $1,691 $23,851 $(19,249) $28,489
Income taxes (benefits) (757) 1,344 41 687 545 6,576 (687) 7,749
Minority interest, net of taxes — — — — — 289 — 289
Equities in undistributed income of subsidiaries 5,169 — — — — — (5,169) —
Income from continuing operations $21,538 $ 3,213 $ 64 $1,235 $1,146 $16,986 $(23,731) $20,451
Income from discontinued operations, net of
taxes — 89 — — — 998 — 1,087
Net income $21,538 $ 3,302 $ 64 $1,235 $1,146 $17,984 $(23,731) $21,538
219