Citibank 2008 Annual Report Download - page 12
Download and view the complete annual report
Please find page 12 of the 2008 Citibank annual report below. You can navigate through the pages in the report by either clicking on the pages listed below, or by using the keyword search tool below to find specific information within the annual report.-
 1
1 -
 2
2 -
 3
3 -
 4
4 -
 5
5 -
 6
6 -
 7
7 -
 8
8 -
 9
9 -
 10
10 -
 11
11 -
 12
12 -
 13
13 -
 14
14 -
 15
15 -
 16
16 -
 17
17 -
 18
18 -
 19
19 -
 20
20 -
 21
21 -
 22
22 -
23
-
24
-
25
-
26
-
27
-
28
-
29
-
30
-
31
-
32
-
33
-
34
-
35
-
36
-
37
-
38
-
39
-
40
-
41
-
42
-
43
-
44
-
45
-
46
-
47
-
48
-
49
-
50
-
51
-
52
-
53
-
54
-
55
-
56
-
57
-
58
-
59
-
60
-
61
-
62
-
63
-
64
-
65
-
66
-
67
-
68
-
69
-
70
-
71
-
72
-
73
-
74
-
75
-
76
-
77
-
78
-
79
-
80
-
81
-
82
-
83
-
84
-
85
-
86
-
87
-
88
-
89
-
90
-
91
-
92
-
93
-
94
-
95
-
96
-
97
-
98
-
99
-
100
-
101
-
102
-
103
-
104
-
105
-
106
-
107
-
108
-
109
-
110
-
111
-
112
-
113
-
114
-
115
-
116
-
117
-
118
-
119
-
120
-
121
-
122
-
123
-
124
-
125
-
126
-
127
-
128
-
129
-
130
-
131
-
132
-
133
-
134
-
135
-
136
-
137
-
138
-
139
-
140
-
141
-
142
-
143
-
144
-
145
-
146
-
147
-
148
-
149
-
150
-
151
-
152
-
153
-
154
-
155
-
156
-
157
-
158
-
159
-
160
-
161
-
162
-
163
-
164
-
165
-
166
-
167
-
168
-
169
-
170
-
171
-
172
-
173
-
174
-
175
-
176
-
177
-
178
-
179
-
180
-
181
-
182
-
183
-
184
-
185
-
186
-
187
-
188
-
189
-
190
-
191
-
192
-
193
-
194
-
195
-
196
-
197
-
198
-
199
-
200
-
201
-
202
-
203
-
204
-
205
-
206
-
207
-
208
-
209
-
210
-
211
-
212
-
213
-
214
-
215
-
216
-
217
-
218
-
219
-
220
-
221
-
222
-
223
-
224
-
225
-
226
-
227
-
228
-
229
-
230
-
231
-
232
-
233
-
234
-
235
-
236
-
237
-
238
-
239
-
240
-
241
-
242
-
243
-
244
-
245
-
246
-
247
-
248
-
249
-
250
-
251
-
252
 |
 |
MANAGEMENT’S DISCUSSION AND ANALYSIS
2008 IN SUMMARY
Citigroup reported a $32.1 billion loss from continuing operations ($6.42 per
share) for 2008. The results were impacted by continued losses related to the
disruption in the fixed income markets, higher consumer credit costs, and a
deepening of the global economic slowdown.
The net loss of $27.7 billion ($5.59 per share) in 2008 includes the results
and sales of the Company’s German retail banking operations and
CitiCapital (which were reflected as discontinued operations), as well as a
$9.568 billion Goodwill impairment charge based on the results of its fourth
quarter of 2008 goodwill impairment testing. The goodwill impairment
charge was recorded in North America Consumer Banking, Latin America
Consumer Banking and EMEA Consumer Banking.
During 2008, the Company benefited from substantial U.S. government
financial involvement, including (i) raising an aggregate $45 billion in
capital through the sale of Citigroup non-voting perpetual, cumulative
preferred stock and warrants to purchase common stock to the U.S.
Department of the Treasury (UST), (ii) entering into a loss-sharing
agreement with various U.S. government entities covering $301 billion of
Company assets, and (iii) issuing $5.75 billion of senior unsecured debt
guaranteed by the Federal Deposit Insurance Corporation (FDIC) (in
addition to $26.0 billion of commercial paper and interbank deposits of
Citigroup’s subsidiaries guaranteed by the FDIC outstanding as of
December 31, 2008). In connection with these programs and agreements,
Citigroup is required to pay consideration to the U.S. government, including
in the form of dividends on the preferred stock and other fees. In addition,
Citigroup has agreed not to pay common stock dividends in excess of $0.01
per share per quarter for three years (beginning in 2009) or to repurchase its
common stock without the consent of U.S. government entities. For
additional information on the above, see “TARP and Other Regulatory
Programs” on page 44.
In addition to the equity issuances to the UST under TARP, Citigroup
raised $32 billion of capital in private and public offerings during 2008.
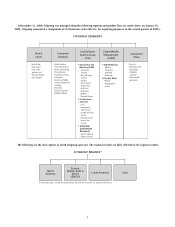
In addition, on January 16, 2009, the Company announced a
realignment, for management and reporting purposes, into two businesses:
Citicorp, primarily comprised of the Company’s Global Institutional Bank
and the Company’s regional consumer banks; and Citi Holdings, primarily
comprised of the Company’s brokerage and asset management business,
local consumer finance business, and a special asset pool. Citigroup believes
that the realignment will optimize the Company’s global businesses for
future profitable growth and opportunities and will assist in the Company’s
ongoing efforts to reduce its balance sheet and simplify its organization. See
“Outlook for 2009” on page 7.
On February 27, 2009, the Company announced an exchange offer of its
common stock for up to $27.5 billion of its existing preferred securities and
trust preferred securities at a conversion price of $3.25 per share. The U.S.
government will match this exchange up to a maximum of $25 billion of its
preferred stock at the same conversion price. These transactions are intended
to increase the Company’s tangible common equity (TCE) and will require
no additional U.S. government investment in Citigroup. See “Outlook for
2009” on page 7.
During 2008, the Company also completed 19 strategic divestitures which
were designed to strengthen our franchises.
Revenues of $52.8 billion decreased 33% from 2007, primarily driven by
significantly lower revenues in ICG due to write-downs related to subprime
CDOs and leveraged lending and other fixed income exposures. Revenues
outside of ICG declined 6%. The Company’s revenues outside North America
declined 4% from 2007.
Net interest revenue grew 18% from 2007, reflecting the lower cost of funds,
as well as lower rates outside the U.S. The lower cost of funds more than offset
the decrease in the asset yields during the year. Net interest margin in 2008 was
3.06%, up 65 basis points from 2007 (see the discussion of net interest margin
on page 82). Non-interest revenue decreased $34 billion from 2007, primarily
reflecting subprime and fixed income write-downs.
Although the Company made significant progress in reducing its expense
base during the year, operating expenses increased 19% from the previous
year with lower operating expenses being offset by a $9.568 billion goodwill
impairment charge, higher restructuring/ repositioning charges and the
impact of acquisitions. Excluding the goodwill impairment charge, expenses
have declined for four consecutive quarters, due to lower incentive
compensation accruals and continued benefits from re-engineering efforts.
Headcount was down 52,000 from December 31, 2007.
The Company’s equity capital base and trust preferred securities were $165.5
billion at December 31, 2008. Stockholders’ equity increased by $28.2 billion
during 2008 to $141.6 billion, which was affected by capital issuances discussed
above, and the distribution of $7.6 billion in dividends to common and
preferred shareholders. Citigroup maintained its “well-capitalized” position
with a Tier 1 Capital Ratio of 11.92% at December 31, 2008.
Total credit costs of $33.3 billion included NCLs of $19.0 billion, up from
$9.9 billion in 2007, and a net build of $14.3 billion to credit reserves. The
build consisted of $10.8 billion in Consumer ($8.2 billion in North America
and $2.6 billion in regions outside North America), $3.3 billion in ICG and
$249 million in GWM (see “Credit Reserves” on page 11 for further
discussion). The Consumer loan loss rate was 3.75%, a 149 basis-point
increase from the fourth quarter of 2007. Corporate cash-basis loans were
$9.6 billion at December 31, 2008, an increase of $7.8 billion from year-ago
levels. This increase is primarily attributable to the transfer of non-accrual
loans from the held-for-sale portfolio to the held-for-investment portfolio
during the fourth quarter of 2008. The allowance for loan losses totaled
$29.6 billion at December 31, 2008, a coverage ratio of 4.27% of total loans.
The effective tax rate (benefit) of (39)% in 2008 primarily resulted from
the pretax losses in the Company’s Securities and Banking business taxed in
the U.S. (the U.S. is a higher tax-rate jurisdiction). In addition, the tax
benefits of permanent differences, including the tax benefit for not providing
U.S. income taxes on the earnings of certain foreign subsidiaries that are
indefinitely invested, favorably affected the Company’s effective tax rate.
At December 31, 2008, the Company had increased its structural liquidity
(equity, long-term debt and deposits) as a percentage of assets from 62% at
December 31, 2007 to approximately 66% at December 31, 2008. Citigroup
has continued its deleveraging, reducing total assets from $2,187 billion at
December 31, 2007 to $1,938 billion at December 31, 2008.
At December 31, 2008, the maturity profile of Citigroup’s senior long-term
unsecured borrowings had a weighted average maturity of seven years.
Citigroup also reduced its commercial paper program from $35 billion at
December 31, 2007 to $29 billion at December 31, 2008.
Recently, Robert Rubin, Sir Win Bischoff and Roberto Hernández
Ramirez announced they would not stand for re-election at Citigroup’s 2009
Annual Meeting of Stockholders. On February 23, 2009, Richard Parsons
became the Chairman of the Company.
6