Citibank 2008 Annual Report Download - page 163
Download and view the complete annual report
Please find page 163 of the 2008 Citibank annual report below. You can navigate through the pages in the report by either clicking on the pages listed below, or by using the keyword search tool below to find specific information within the annual report.-
 1
1 -
2
-
3
-
4
-
5
-
6
-
7
-
8
-
9
-
10
-
11
-
12
-
13
-
14
-
15
-
16
-
17
-
18
-
19
-
20
-
21
-
22
-
23
-
24
-
25
-
26
-
27
-
28
-
29
-
30
-
31
-
32
-
33
-
34
-
35
-
36
-
37
-
38
-
39
-
40
-
41
-
42
-
43
-
44
-
45
-
46
-
47
-
48
-
49
-
50
-
51
-
52
-
53
-
54
-
55
-
56
-
57
-
58
-
59
-
60
-
61
-
62
-
63
-
64
-
65
-
66
-
67
-
68
-
69
-
70
-
71
-
72
-
73
-
74
-
75
-
76
-
77
-
78
-
79
-
80
-
81
-
82
-
83
-
84
-
85
-
86
-
87
-
88
-
89
-
90
-
91
-
92
-
93
-
94
-
95
-
96
-
97
-
98
-
99
-
100
-
101
-
102
-
103
-
104
-
105
-
106
-
107
-
108
-
109
-
110
-
111
-
112
-
113
-
114
-
115
-
116
-
117
-
118
-
119
-
120
-
121
-
122
-
123
-
124
-
125
-
126
-
127
-
128
-
129
-
130
-
131
-
132
-
133
-
134
-
135
-
136
-
137
-
138
-
139
-
140
-
141
-
142
-
143
-
144
-
145
-
146
-
147
-
148
-
149
-
150
-
151
-
152
-
 153
153 -
 154
154 -
 155
155 -
 156
156 -
 157
157 -
 158
158 -
 159
159 -
 160
160 -
 161
161 -
 162
162 -
 163
163 -
 164
164 -
 165
165 -
 166
166 -
 167
167 -
 168
168 -
 169
169 -
 170
170 -
 171
171 -
 172
172 -
 173
173 -
174
-
175
-
176
-
177
-
178
-
179
-
180
-
181
-
182
-
183
-
184
-
185
-
186
-
187
-
188
-
189
-
190
-
191
-
192
-
193
-
194
-
195
-
196
-
197
-
198
-
199
-
200
-
201
-
202
-
203
-
204
-
205
-
206
-
207
-
208
-
209
-
210
-
211
-
212
-
213
-
214
-
215
-
216
-
217
-
218
-
219
-
220
-
221
-
222
-
223
-
224
-
225
-
226
-
227
-
228
-
229
-
230
-
231
-
232
-
233
-
234
-
235
-
236
-
237
-
238
-
239
-
240
-
241
-
242
-
243
-
244
-
245
-
246
-
247
-
248
-
249
-
250
-
251
-
252
 |
 |

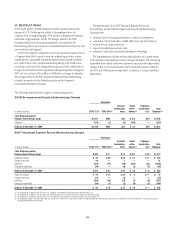
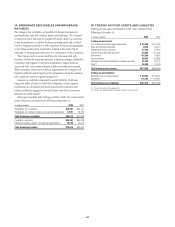
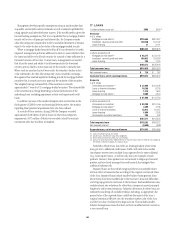
14. BROKERAGE RECEIVABLES AND BROKERAGE
PAYABLES
The Company has receivables and payables for financial instruments
purchased from and sold to brokers, dealers and customers. The Company
is exposed to risk of loss from the inability of brokers, dealers or customers
to pay for purchases or to deliver the financial instruments sold, in which
case the Company would have to sell or purchase the financial instruments
at prevailing market prices. Credit risk is reduced to the extent that an
exchange or clearing organization acts as a counterparty to the transaction.
The Company seeks to protect itself from the risks associated with
customer activities by requiring customers to maintain margin collateral in
compliance with regulatory and internal guidelines. Margin levels are
monitored daily, and customers deposit additional collateral as required.
Where customers cannot meet collateral requirements, the Company will
liquidate sufficient underlying financial instruments to bring the customer
into compliance with the required margin level.
Exposure to credit risk is impacted by market volatility, which may
impair the ability of clients to satisfy their obligations to the Company.
Credit limits are established and closely monitored for customers and
brokers and dealers engaged in forwards, futures and other transactions
deemed to be credit sensitive.
Brokerage receivables and brokerage payables, which arise in the normal
course of business, consisted of the following at December 31:
In millions of dollars 2008 2007
Receivables from customers $26,297 $39,137
Receivables from brokers, dealers, and clearing organizations 17,981 18,222
Total brokerage receivables $44,278 $57,359
Payables to customers $54,167 $54,038
Payables to brokers, dealers, and clearing organizations 16,749 30,913
Total brokerage payables $70,916 $84,951
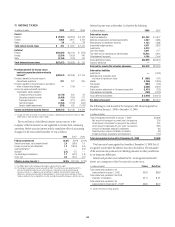
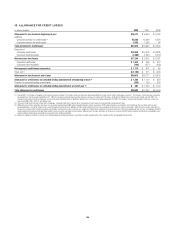
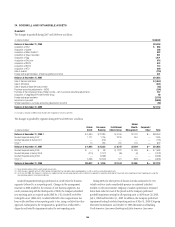
15. TRADING ACCOUNT ASSETS AND LIABILITIES
Trading account assets and liabilities, at fair value, consisted of the
following at December 31:
In millions of dollars 2008 2007
Trading account assets
U.S. Treasury and federal agency securities $ 44,369 $ 32,180
State and municipal securities 9,510 18,574
Foreign government securities 57,422 52,332
Corporate and other debt securities 54,654 181,333
Derivatives (1) 115,289 76,881
Equity securities 48,503 106,868
Mortgage loans and collateralized mortgage securities 21,830 56,740
Other (2) 26,058 14,076
Total trading account assets $377,635 $538,984
Trading account liabilities
Securities sold, not yet purchased $ 50,693 $ 78,541
Derivatives (1) 116,785 103,541
Total trading account liabilities $167,478 $182,082
(1) Pursuant to master netting agreements.
(2) Includes commodity inventory measured at lower of cost or market.
157