Citibank 2008 Annual Report Download - page 182
Download and view the complete annual report
Please find page 182 of the 2008 Citibank annual report below. You can navigate through the pages in the report by either clicking on the pages listed below, or by using the keyword search tool below to find specific information within the annual report.-
 1
1 -
2
-
3
-
4
-
5
-
6
-
7
-
8
-
9
-
10
-
11
-
12
-
13
-
14
-
15
-
16
-
17
-
18
-
19
-
20
-
21
-
22
-
23
-
24
-
25
-
26
-
27
-
28
-
29
-
30
-
31
-
32
-
33
-
34
-
35
-
36
-
37
-
38
-
39
-
40
-
41
-
42
-
43
-
44
-
45
-
46
-
47
-
48
-
49
-
50
-
51
-
52
-
53
-
54
-
55
-
56
-
57
-
58
-
59
-
60
-
61
-
62
-
63
-
64
-
65
-
66
-
67
-
68
-
69
-
70
-
71
-
72
-
73
-
74
-
75
-
76
-
77
-
78
-
79
-
80
-
81
-
82
-
83
-
84
-
85
-
86
-
87
-
88
-
89
-
90
-
91
-
92
-
93
-
94
-
95
-
96
-
97
-
98
-
99
-
100
-
101
-
102
-
103
-
104
-
105
-
106
-
107
-
108
-
109
-
110
-
111
-
112
-
113
-
114
-
115
-
116
-
117
-
118
-
119
-
120
-
121
-
122
-
123
-
124
-
125
-
126
-
127
-
128
-
129
-
130
-
131
-
132
-
133
-
134
-
135
-
136
-
137
-
138
-
139
-
140
-
141
-
142
-
143
-
144
-
145
-
146
-
147
-
148
-
149
-
150
-
151
-
152
-
153
-
154
-
155
-
156
-
157
-
158
-
159
-
160
-
161
-
162
-
163
-
164
-
165
-
166
-
167
-
168
-
169
-
170
-
171
-
 172
172 -
 173
173 -
 174
174 -
 175
175 -
 176
176 -
 177
177 -
 178
178 -
 179
179 -
 180
180 -
 181
181 -
 182
182 -
 183
183 -
 184
184 -
 185
185 -
 186
186 -
 187
187 -
 188
188 -
 189
189 -
 190
190 -
 191
191 -
 192
192 -
193
-
194
-
195
-
196
-
197
-
198
-
199
-
200
-
201
-
202
-
203
-
204
-
205
-
206
-
207
-
208
-
209
-
210
-
211
-
212
-
213
-
214
-
215
-
216
-
217
-
218
-
219
-
220
-
221
-
222
-
223
-
224
-
225
-
226
-
227
-
228
-
229
-
230
-
231
-
232
-
233
-
234
-
235
-
236
-
237
-
238
-
239
-
240
-
241
-
242
-
243
-
244
-
245
-
246
-
247
-
248
-
249
-
250
-
251
-
252
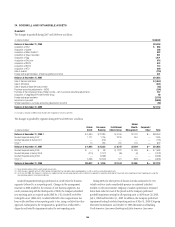
 |
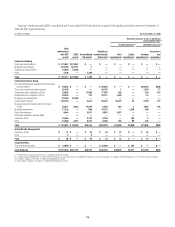
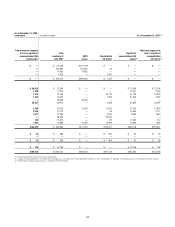
 |

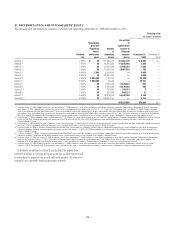
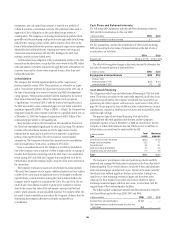
Citigroup’s involvement with QSPEs, Consolidated and Unconsolidated VIEs with which the Company holds significant variable interests as of December 31,
2008 and 2007 is presented below:
In millions of dollars As of December 31, 2008
Maximum exposure to loss in significant
unconsolidated VIEs (1)
Funded exposures (3) Unfunded exposures (4)
Total
involvement
with SPE
assets
QSPE
assets
Consolidated
VIE assets
Significant
unconsolidated
VIE assets (2)
Debt
investments
Equity
investments
Funding
commitments
Guarantees
and
derivatives
Consumer Banking
Credit card securitizations $ 123,867 $123,867 $ — $ — $ — $ — $ — $ —
Mortgage securitizations 584,154 584,151 3 — — — — —
Student loan securitizations 15,650 15,650 — — — — — —
Other 1,446 — 1,446 — — — — —
Total $ 725,117 $723,668 $ 1,449 $ — $ — $ — $ — $ —
Institutional Clients Group
Citi-administered asset-backed commercial paper
conduits (ABCP) $ 59,635 $ — $ — $ 59,635 $ — $ — $59,435 $200
Third-party commercial paper conduits 20,755 — — 20,755 2 — 1,380 17
Collateralized debt obligations (CDOs) 29,055 — 11,466 17,589 928 — 230 315
Collateralized loan obligations (CLOs) 20,253 — 122 20,131 1,430 — 14 —
Mortgage loan securitization 87,209 87,209 — — — — — —
Asset-based financing 102,154 — 3,847 98,307 25,275 45 2,799 112
Municipal securities tender option bond trusts
(TOBs) 30,071 6,504 14,619 8,948 652 3 7,067 162
Municipal investments 17,138 — 866 16,272 — 2,746 790 —
Client intermediation 9,464 — 3,811 5,653 1,537 — — —
Structured investment vehicles (SIVs) —— — — — — — —
Investment funds 10,556 — 2,157 8,399 — 156 2 —
Other 21,668 4,751 8,527 8,390 784 99 379 —
Total $ 407,958 $ 98,464 $45,415 $264,079 $30,608 $3,049 $72,096 $806
Global Wealth Management
Investment funds $ 71 $ — $ 45 $ 26 $ 22 $ — $ 10 $ —
Other 9— 9 — — — — —
Total $ 80 $ — $ 54 $ 26 $ 22 $ — $ 10 $ —
Corporate/Other
Trust preferred securities $ 23,899 $ — $ — $ 23,899 $ — $ 162 $ — $ —
Total Citigroup $1,157,054 $822,132 $46,918 $288,004 $30,630 $3,211 $72,106 $806
(1) The definition of maximum exposure to loss is included in the text that follows.
(2) A significant unconsolidated VIE is an entity where the Company has any variable interest considered to be significant as discussed on page 175 regardless of the likelihood of loss or the notional amount of exposure.
(3) Included in Citigroup’s December 31, 2008 Consolidated Balance Sheet.
(4) Not included in Citigroup’s December 31, 2008 Consolidated Balance Sheet.
176