Citibank 2008 Annual Report Download - page 84
Download and view the complete annual report
Please find page 84 of the 2008 Citibank annual report below. You can navigate through the pages in the report by either clicking on the pages listed below, or by using the keyword search tool below to find specific information within the annual report.-
 1
1 -
2
-
3
-
4
-
5
-
6
-
7
-
8
-
9
-
10
-
11
-
12
-
13
-
14
-
15
-
16
-
17
-
18
-
19
-
20
-
21
-
22
-
23
-
24
-
25
-
26
-
27
-
28
-
29
-
30
-
31
-
32
-
33
-
34
-
35
-
36
-
37
-
38
-
39
-
40
-
41
-
42
-
43
-
44
-
45
-
46
-
47
-
48
-
49
-
50
-
51
-
52
-
53
-
54
-
55
-
56
-
57
-
58
-
59
-
60
-
61
-
62
-
63
-
64
-
65
-
66
-
67
-
68
-
69
-
70
-
71
-
72
-
73
-
 74
74 -
 75
75 -
 76
76 -
 77
77 -
 78
78 -
 79
79 -
 80
80 -
 81
81 -
 82
82 -
 83
83 -
 84
84 -
 85
85 -
 86
86 -
 87
87 -
 88
88 -
 89
89 -
 90
90 -
 91
91 -
 92
92 -
 93
93 -
 94
94 -
95
-
96
-
97
-
98
-
99
-
100
-
101
-
102
-
103
-
104
-
105
-
106
-
107
-
108
-
109
-
110
-
111
-
112
-
113
-
114
-
115
-
116
-
117
-
118
-
119
-
120
-
121
-
122
-
123
-
124
-
125
-
126
-
127
-
128
-
129
-
130
-
131
-
132
-
133
-
134
-
135
-
136
-
137
-
138
-
139
-
140
-
141
-
142
-
143
-
144
-
145
-
146
-
147
-
148
-
149
-
150
-
151
-
152
-
153
-
154
-
155
-
156
-
157
-
158
-
159
-
160
-
161
-
162
-
163
-
164
-
165
-
166
-
167
-
168
-
169
-
170
-
171
-
172
-
173
-
174
-
175
-
176
-
177
-
178
-
179
-
180
-
181
-
182
-
183
-
184
-
185
-
186
-
187
-
188
-
189
-
190
-
191
-
192
-
193
-
194
-
195
-
196
-
197
-
198
-
199
-
200
-
201
-
202
-
203
-
204
-
205
-
206
-
207
-
208
-
209
-
210
-
211
-
212
-
213
-
214
-
215
-
216
-
217
-
218
-
219
-
220
-
221
-
222
-
223
-
224
-
225
-
226
-
227
-
228
-
229
-
230
-
231
-
232
-
233
-
234
-
235
-
236
-
237
-
238
-
239
-
240
-
241
-
242
-
243
-
244
-
245
-
246
-
247
-
248
-
249
-
250
-
251
-
252
 |
 |

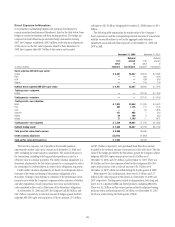
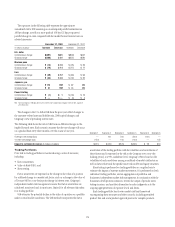
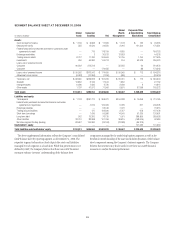
BALANCE SHEET REVIEW
December 31, Increase
(decrease)
%
ChangeIn billions of dollars 2008 2007
Assets
Loans, net of unearned income and allowance for loan losses $ 665 $ 762 $ (97) (13)%
Trading account assets 378 539 (161) (30)
Federal funds sold and securities borrowed or purchased under agreements to resell 184 274 (90) (33)
Investments 256 215 41 19
Other assets 455 397 58 15
Total assets $1,938 $2,187 $(249) (11)%
Liabilities
Deposits $ 774 $ 826 $ (52) (6)%
Federal funds purchased and securities loaned or sold under agreements to repurchase 205 304 (99) (33)
Short-term borrowings and long-term debt 486 574 (88) (15)
Trading account liabilities 167 182 (15) (8)
Other liabilities 164 188 (24) (13)
Total liabilities $1,796 $2,074 $(278) (13)%
Stockholders’ equity $ 142 $ 113 $ 29 26%
Total liabilities and stockholders’ equity $1,938 $2,187 $(249) (11)%
Loans
Loans are an extension of credit to individuals, corporations, or government
institutions. Loans vary across regions and industries and primarily include
credit cards, mortgages, other real estate lending, personal loans, auto loans,
student loans, and corporate loans. The majority of loans are carried at cost
with a minimal amount recorded at fair value in accordance with SFAS 155
and SFAS 159.
Consumer and corporate loans comprised 75% and 25%, respectively, of
total loans (net of unearned income and before the allowance for loan
losses).
During 2008 consumer loans decreased by $83 billion, or 14%, primarily
due to:
• $39 billion, or 14%, decrease in installment and revolving credit; and
• $29 billion, or 10%, decrease in mortgage and real estate loans.
These decreases were partially driven by the sales of CitiCapital and the
German retail banking units. Foreign exchange translation also factored
into the decrease in loans, as a number of currencies weakened against the
dollar.
During 2008 corporate loans decreased $15 billion, or 8%, primarily
driven by a decrease of $10 billion, or 7%, in commercial and industrial
loans.
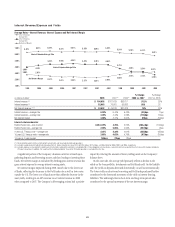
During 2008, average consumer loans (net of unearned income) of
$551 billion yielded an average rate of 8.6%, compared to $523 billion and
9.0% in the prior year. Average corporate loans of $184 billion yielded an
average rate of 8.2% in 2008, compared to $188 billion and 8.5% in the
prior year.
For further information, see “Loans Outstanding” on page 53 and
Note 17 to the Consolidated Financial Statements on page 163.
Trading Account Assets (Liabilities)
Trading account assets include debt and marketable equity securities,
derivatives in a receivable position, residual interests in securitizations, and
physical commodities inventory. In addition, certain assets that Citigroup
has elected to carry at fair value under SFAS 155 and SFAS 159, such as
certain loans and purchase guarantees, are also included in trading account
assets. Trading account liabilities include securities sold, not yet purchased
(short positions) and derivatives in a net payable position as well as certain
liabilities that Citigroup has elected to carry at fair value under SFAS 155 and
SFAS 159.
All trading account assets and liabilities are reported at their fair value,
except for physical commodities inventory which is carried at the lower of cost
or market, with unrealized gains and losses recognized in current income.
During 2008 trading account assets decreased by $161 billion, or 30%,
due to:
• $127 billion, or 70%, decrease in corporate and other debt securities,
driven by a decrease in the SIV assets, a decrease in commercial paper
trading assets and the transfer of trading assets to investments
held-to-maturity and available-for-sale (see “Reclassification of
Financial Assets” on page 87);
• $58 billion, or 55%, decrease in equity securities;
• $35 billion, or 62%, decrease in mortgage loans and collateralized
mortgage securities (CMOs); and
• $9 billion, or 49%, decrease in state and municipal securities;
offset by:
• $38 billion, or 50%, increase in revaluation gains primarily consisting of
increases from interest rates, foreign exchange and credit derivative
contracts, offset by an increase in netting permitted under master netting
agreements;
78