Citibank 2008 Annual Report Download - page 224
Download and view the complete annual report
Please find page 224 of the 2008 Citibank annual report below. You can navigate through the pages in the report by either clicking on the pages listed below, or by using the keyword search tool below to find specific information within the annual report.-
 1
1 -
 2
2 -
 3
3 -
 4
4 -
 5
5 -
 6
6 -
 7
7 -
 8
8 -
 9
9 -
 10
10 -
 11
11 -
 12
12 -
 13
13 -
 14
14 -
 15
15 -
 16
16 -
 17
17 -
 18
18 -
 19
19 -
 20
20 -
 21
21 -
 22
22 -
 23
23 -
 24
24 -
 25
25 -
 26
26 -
 27
27 -
 28
28 -
 29
29 -
 30
30 -
 31
31 -
 32
32 -
 33
33 -
 34
34 -
 35
35 -
 36
36 -
 37
37 -
 38
38 -
 39
39 -
 40
40 -
 41
41 -
 42
42 -
 43
43 -
 44
44 -
 45
45 -
 46
46 -
 47
47 -
 48
48 -
 49
49 -
 50
50 -
 51
51 -
 52
52 -
 53
53 -
 54
54 -
 55
55 -
 56
56 -
 57
57 -
 58
58 -
 59
59 -
 60
60 -
 61
61 -
 62
62 -
 63
63 -
 64
64 -
 65
65 -
 66
66 -
 67
67 -
 68
68 -
 69
69 -
 70
70 -
 71
71 -
 72
72 -
 73
73 -
 74
74 -
 75
75 -
 76
76 -
 77
77 -
 78
78 -
 79
79 -
 80
80 -
 81
81 -
 82
82 -
 83
83 -
 84
84 -
 85
85 -
 86
86 -
 87
87 -
 88
88 -
 89
89 -
 90
90 -
 91
91 -
 92
92 -
 93
93 -
 94
94 -
 95
95 -
 96
96 -
 97
97 -
 98
98 -
 99
99 -
 100
100 -
 101
101 -
 102
102 -
 103
103 -
 104
104 -
 105
105 -
 106
106 -
 107
107 -
 108
108 -
 109
109 -
 110
110 -
 111
111 -
 112
112 -
 113
113 -
 114
114 -
 115
115 -
 116
116 -
 117
117 -
 118
118 -
 119
119 -
 120
120 -
 121
121 -
 122
122 -
 123
123 -
 124
124 -
 125
125 -
 126
126 -
 127
127 -
 128
128 -
 129
129 -
 130
130 -
 131
131 -
 132
132 -
 133
133 -
 134
134 -
 135
135 -
 136
136 -
 137
137 -
 138
138 -
 139
139 -
 140
140 -
 141
141 -
 142
142 -
 143
143 -
 144
144 -
 145
145 -
 146
146 -
 147
147 -
 148
148 -
 149
149 -
 150
150 -
 151
151 -
 152
152 -
 153
153 -
 154
154 -
 155
155 -
 156
156 -
 157
157 -
 158
158 -
 159
159 -
 160
160 -
 161
161 -
 162
162 -
 163
163 -
 164
164 -
 165
165 -
 166
166 -
 167
167 -
 168
168 -
 169
169 -
 170
170 -
 171
171 -
 172
172 -
 173
173 -
 174
174 -
 175
175 -
 176
176 -
 177
177 -
 178
178 -
 179
179 -
 180
180 -
 181
181 -
 182
182 -
 183
183 -
 184
184 -
 185
185 -
 186
186 -
 187
187 -
 188
188 -
 189
189 -
 190
190 -
 191
191 -
 192
192 -
 193
193 -
 194
194 -
 195
195 -
 196
196 -
 197
197 -
 198
198 -
 199
199 -
 200
200 -
 201
201 -
 202
202 -
 203
203 -
 204
204 -
 205
205 -
 206
206 -
 207
207 -
 208
208 -
 209
209 -
 210
210 -
 211
211 -
 212
212 -
 213
213 -
 214
214 -
 215
215 -
 216
216 -
 217
217 -
 218
218 -
 219
219 -
 220
220 -
 221
221 -
 222
222 -
 223
223 -
 224
224 -
 225
225 -
 226
226 -
 227
227 -
 228
228 -
 229
229 -
 230
230 -
 231
231 -
 232
232 -
 233
233 -
 234
234 -
 235
235 -
 236
236 -
 237
237 -
 238
238 -
 239
239 -
 240
240 -
 241
241 -
 242
242 -
 243
243 -
 244
244 -
 245
245 -
 246
246 -
 247
247 -
 248
248 -
 249
249 -
 250
250 -
 251
251 -
 252
252
 |
 |

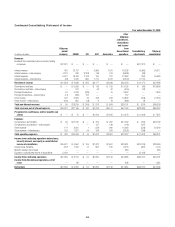
Condensed Consolidating Statement of Income
Year ended December 31, 2007
In millions of dollars
Citigroup
parent
company CGMHI CFI CCC Associates
Other
Citigroup
subsidiaries,
eliminations
and income
from
discontinued
operations
Consolidating
adjustments
Citigroup
consolidated
Revenues
Dividends from subsidiary banks and bank holding
companies $10,632 $ — $ — $ — $ — $ — $(10,632) $ —
Interest revenue 426 31,438 6 6,754 7,854 81,705 (6,754) 121,429
Interest revenue—intercompany 5,507 1,695 6,253 137 630 (14,085) (137) —
Interest expense 7,994 24,489 4,331 189 759 38,478 (189) 76,051
Interest expense—intercompany (80) 5,871 882 2,274 2,955 (9,628) (2,274) —
Net interest revenue $ (1,981) $ 2,773 $1,046 $4,428 $4,770 $38,770 $ (4,428) $45,378
Commissions and fees $ — $ 11,089 $ — $ 95 $ 186 $ 9,431 $ (95) $20,706
Commissions and fees—intercompany (3) 184 — 21 25 (206) (21) —
Principal transactions 380 (11,382) (68) — 2 (1,018) — (12,086)
Principal transactions—intercompany 118 605 (561) — (30) (132) — —
Other income (1,233) 4,594 150 452 664 20,322 (452) 24,497
Other income—intercompany 1,008 1,488 (117) 26 (30) (2,349) (26) —
Total non-interest revenues $ 270 $ 6,578 $ (596) $ 594 $ 817 $26,048 $ (594) $33,117
Total revenues, net of interest expense $ 8,921 $ 9,351 $ 450 $5,022 $5,587 $64,818 $(15,654) $78,495
Provisions for credit losses and for benefits and
claims $ — $ 40 $ — $2,515 $2,786 $15,091 $ (2,515) $17,917
Expenses
Compensation and benefits $ 170 $ 11,631 $ — $ 679 $ 894 $21,197 $ (679) $33,892
Compensation and benefits—intercompany 11 1 — 161 162 (174) (161) —
Other expense 383 3,696 2 524 713 21,116 (524) 25,910
Other expense—intercompany 241 1,959 71 299 397 (2,668) (299) —
Total operating expenses $ 805 $ 17,287 $ 73 $1,663 $2,166 $39,471 $ (1,663) $59,802
Income (loss) from continuing operations before
taxes, minority interest, and equity in
undistributed income of subsidiaries $ 8,116 $ (7,976) $ 377 $ 844 $ 635 $10,256 $(11,476) $ 776
Income taxes (benefits) (933) (3,050) 133 287 205 1,147 (287) (2,498)
Minority interest, net of taxes — — — — — 285 — 285
Equities in undistributed income of subsidiaries (5,432) — — — — — 5,432 —
Income (loss) from continuing operations $ 3,617 $ (4,926) $ 244 $ 557 $ 430 $ 8,824 $ (5,757) $ 2,989
Income from discontinued operations, net of
taxes — — — — — 628 — 628
Net income (loss) $ 3,617 $ (4,926) $ 244 $ 557 $ 430 $ 9,452 $ (5,757) $ 3,617
218
