Citibank 2008 Annual Report Download - page 168
Download and view the complete annual report
Please find page 168 of the 2008 Citibank annual report below. You can navigate through the pages in the report by either clicking on the pages listed below, or by using the keyword search tool below to find specific information within the annual report.-
 1
1 -
2
-
3
-
4
-
5
-
6
-
7
-
8
-
9
-
10
-
11
-
12
-
13
-
14
-
15
-
16
-
17
-
18
-
19
-
20
-
21
-
22
-
23
-
24
-
25
-
26
-
27
-
28
-
29
-
30
-
31
-
32
-
33
-
34
-
35
-
36
-
37
-
38
-
39
-
40
-
41
-
42
-
43
-
44
-
45
-
46
-
47
-
48
-
49
-
50
-
51
-
52
-
53
-
54
-
55
-
56
-
57
-
58
-
59
-
60
-
61
-
62
-
63
-
64
-
65
-
66
-
67
-
68
-
69
-
70
-
71
-
72
-
73
-
74
-
75
-
76
-
77
-
78
-
79
-
80
-
81
-
82
-
83
-
84
-
85
-
86
-
87
-
88
-
89
-
90
-
91
-
92
-
93
-
94
-
95
-
96
-
97
-
98
-
99
-
100
-
101
-
102
-
103
-
104
-
105
-
106
-
107
-
108
-
109
-
110
-
111
-
112
-
113
-
114
-
115
-
116
-
117
-
118
-
119
-
120
-
121
-
122
-
123
-
124
-
125
-
126
-
127
-
128
-
129
-
130
-
131
-
132
-
133
-
134
-
135
-
136
-
137
-
138
-
139
-
140
-
141
-
142
-
143
-
144
-
145
-
146
-
147
-
148
-
149
-
150
-
151
-
152
-
153
-
154
-
155
-
156
-
157
-
 158
158 -
 159
159 -
 160
160 -
 161
161 -
 162
162 -
 163
163 -
 164
164 -
 165
165 -
 166
166 -
 167
167 -
 168
168 -
 169
169 -
 170
170 -
 171
171 -
 172
172 -
 173
173 -
 174
174 -
 175
175 -
 176
176 -
 177
177 -
 178
178 -
179
-
180
-
181
-
182
-
183
-
184
-
185
-
186
-
187
-
188
-
189
-
190
-
191
-
192
-
193
-
194
-
195
-
196
-
197
-
198
-
199
-
200
-
201
-
202
-
203
-
204
-
205
-
206
-
207
-
208
-
209
-
210
-
211
-
212
-
213
-
214
-
215
-
216
-
217
-
218
-
219
-
220
-
221
-
222
-
223
-
224
-
225
-
226
-
227
-
228
-
229
-
230
-
231
-
232
-
233
-
234
-
235
-
236
-
237
-
238
-
239
-
240
-
241
-
242
-
243
-
244
-
245
-
246
-
247
-
248
-
249
-
250
-
251
-
252
 |
 |

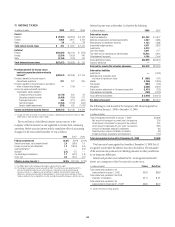
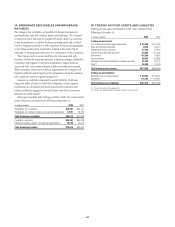
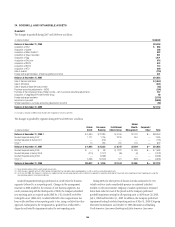
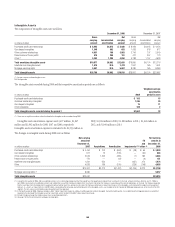
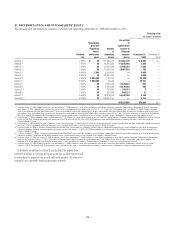
The following table presents the carrying value and fair value of debt
securities held-to-maturity by contractual maturity dates as of December 31,
2008:
In millions of dollars
Carrying
value Fair value
Mortgage-backed securities
Due within 1 year $ 73 $ 50
After 1 but within 5 years 102 101
After 5 but within 10 years 32 32
After 10 years (1) 30,531 27,568
Total $30,738 $27,751
State and municipal
Due within 1 year $ 138 $ 138
After 1 but within 5 years 137 137
After 5 but within 10 years 105 100
After 10 years (1) 5,321 4,992
Total $ 5,701 $ 5,367
All other (2)
Due within 1 year $ 4,448 $ 4,471
After 1 but within 5 years 11,142 10,862
After 5 but within 10 years 6,821 6,604
After 10 years (1) 5,609 5,322
Total $28,020 $27,259
Total debt securities held-to-maturity $64,459 $60,377
(1) Investments with no stated maturities are included as contractual maturities of greater than 10 years.
Actual maturities may differ due to call or prepayment rights.
(2) Includes asset-backed securities and all other debt securities.
Evaluating Investments for Other-than-Temporary
Impairments
The Company conducts periodic reviews to identify and evaluate each
investment that has an unrealized loss, in accordance with FASB Staff
Position No. 115-1, The Meaning of Other-Than-Temporary Impairment
and Its Application to Certain Investments (FSP FAS 115-1). An unrealized
loss exists when the current fair value of an individual security is less than its
amortized cost basis. Unrealized losses that are determined to be temporary
in nature are recorded, net of tax, in Accumulated other comprehensive
income (AOCI) for available-for-sale securities, while such losses related to
held-to-maturity securities are not recorded, as these investments are carried
at their amortized cost (less any permanent impairment). For securities
transferred to held-to-maturity from Trading account assets, amortized cost
is defined as the fair value amount of the securities at the date of transfer.
For securities transferred to held-to-maturity from available-for-sale,
amortized cost is defined as the original purchase cost, plus or minus any
accretion or amortization of interest, less any impairment recognized in
earnings.
Regardless of the classification of the securities as available-for-sale or
held-to-maturity, the Company has assessed each position for credit
impairment.
Factors considered in determining whether a loss is temporary include:
• the length of time and the extent to which fair value has been below cost;
• the severity of the impairment;
• the cause of the impairment and the financial condition and near-term
prospects of the issuer;
• activity in the market of the issuer which may indicate adverse credit
conditions; and
• the Company’s ability and intent to hold the investment for a period of
time sufficient to allow for any anticipated recovery.
The Company’s review for impairment generally entails:
• identification and evaluation of investments that have indications of
possible impairment;
• analysis of individual investments that have fair values less than
amortized cost, including consideration of the length of time the
investment has been in an unrealized loss position and the expected
recovery period;
• discussion of evidential matter, including an evaluation of factors or
triggers that could cause individual investments to qualify as having
other-than-temporary impairment and those that would not support
other-than-temporary impairment; and
• documentation of the results of these analyses, as required under business
policies.
The extent of the Company’s analysis regarding credit quality and the
stress on assumptions used in the analysis have been refined for securities
where the current fair value or other characteristics of the security warrant.
For example, given the declines in fair values of mortgage-backed securities,
general concerns regarding housing prices and the delinquency and default
rates on the mortgage loans underlying these securities, the Company’s
analysis for identifying securities for which it is not probable that all
principal and interest contractually due will be recovered have been refined.
More specifically, for U.S. mortgage-backed securities (and in particular
for Alt-A and other mortgage-backed securities that have significant
unrealized losses as a percentage of amortized cost), credit impairment is
assessed using a cash flow model that estimates the cash flows on the
underlying mortgages, using the security-specific collateral and transaction
structure. The model estimates cash flows from the underlying mortgage
loans and distributes those cash flows to various tranches of securities,
considering the transaction structure and any subordination and credit
enhancements that exist in that structure. The cash flow model incorporates
actual cash flows on the mortgage-backed securities through the current
period and then projects the remaining cash flows using a number of
assumptions, including default rates, prepayment rates, and recovery rates
(on foreclosed properties).
162