Citibank 2008 Annual Report Download - page 79
Download and view the complete annual report
Please find page 79 of the 2008 Citibank annual report below. You can navigate through the pages in the report by either clicking on the pages listed below, or by using the keyword search tool below to find specific information within the annual report.-
 1
1 -
2
-
3
-
4
-
5
-
6
-
7
-
8
-
9
-
10
-
11
-
12
-
13
-
14
-
15
-
16
-
17
-
18
-
19
-
20
-
21
-
22
-
23
-
24
-
25
-
26
-
27
-
28
-
29
-
30
-
31
-
32
-
33
-
34
-
35
-
36
-
37
-
38
-
39
-
40
-
41
-
42
-
43
-
44
-
45
-
46
-
47
-
48
-
49
-
50
-
51
-
52
-
53
-
54
-
55
-
56
-
57
-
58
-
59
-
60
-
61
-
62
-
63
-
64
-
65
-
66
-
67
-
68
-
 69
69 -
 70
70 -
 71
71 -
 72
72 -
 73
73 -
 74
74 -
 75
75 -
 76
76 -
 77
77 -
 78
78 -
 79
79 -
 80
80 -
 81
81 -
 82
82 -
 83
83 -
 84
84 -
 85
85 -
 86
86 -
 87
87 -
 88
88 -
 89
89 -
90
-
91
-
92
-
93
-
94
-
95
-
96
-
97
-
98
-
99
-
100
-
101
-
102
-
103
-
104
-
105
-
106
-
107
-
108
-
109
-
110
-
111
-
112
-
113
-
114
-
115
-
116
-
117
-
118
-
119
-
120
-
121
-
122
-
123
-
124
-
125
-
126
-
127
-
128
-
129
-
130
-
131
-
132
-
133
-
134
-
135
-
136
-
137
-
138
-
139
-
140
-
141
-
142
-
143
-
144
-
145
-
146
-
147
-
148
-
149
-
150
-
151
-
152
-
153
-
154
-
155
-
156
-
157
-
158
-
159
-
160
-
161
-
162
-
163
-
164
-
165
-
166
-
167
-
168
-
169
-
170
-
171
-
172
-
173
-
174
-
175
-
176
-
177
-
178
-
179
-
180
-
181
-
182
-
183
-
184
-
185
-
186
-
187
-
188
-
189
-
190
-
191
-
192
-
193
-
194
-
195
-
196
-
197
-
198
-
199
-
200
-
201
-
202
-
203
-
204
-
205
-
206
-
207
-
208
-
209
-
210
-
211
-
212
-
213
-
214
-
215
-
216
-
217
-
218
-
219
-
220
-
221
-
222
-
223
-
224
-
225
-
226
-
227
-
228
-
229
-
230
-
231
-
232
-
233
-
234
-
235
-
236
-
237
-
238
-
239
-
240
-
241
-
242
-
243
-
244
-
245
-
246
-
247
-
248
-
249
-
250
-
251
-
252
 |
 |

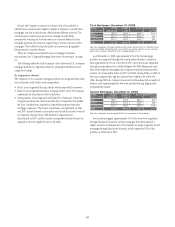
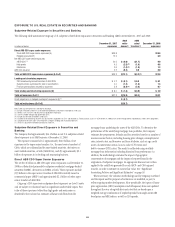
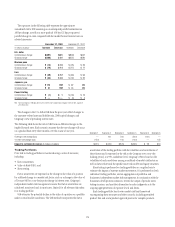
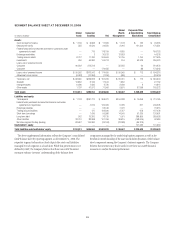
The exposures in the following table represent the approximate
annualized risk to NIR assuming an unanticipated parallel instantaneous
100 bps change, as well as a more gradual 100 bps (25 bps per quarter)
parallel change in rates compared with the market forward interest rates in
selected currencies.
December 31, 2008 December 31, 2007
In millions of dollars Increase Decrease Increase Decrease
U.S. dollar
Instantaneous change $(801) $391 $(940) $837
Gradual change $(456) $ 81 $(527) $540
Mexican peso
Instantaneous change $ (18) $ 18 $ (25) $ 25
Gradual change $ (14) $ 14 $ (17) $ 17
Euro
Instantaneous change $ (56) $ 57 $ (63) $ 63
Gradual change $ (43) $ 43 $ (32) $ 32
Japanese yen
Instantaneous change $ 172 NM $67 NM
Gradual change $51 NM $43 NM
Pound sterling
Instantaneous change $ (1) $ 1 $ (16) $ 16
Gradual change $— $— $ (4) $ 4
NM Not meaningful. A 100 bps decrease in interest rates would imply negative rates for the Japanese
yen yield curve.
The changes in the U.S. dollar IRE from the prior year reflect changes in
the customer-related asset and liability mix, 2008 capital changes, and
Citigroup’s view of prevailing interest rates.
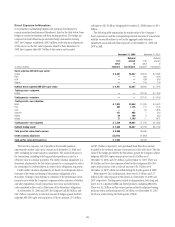
The following table shows the risk to NIR from six different changes in the
implied forward rates. Each scenario assumes that the rate change will occur
on a gradual basis every three months over the course of one year. Scenario 1 Scenario 2 Scenario 3 Scenario 4 Scenario 5 Scenario 6
Overnight rate change (bps) — 100 200 (200) (100) —
10-year rate change (bps) (100) — 100 (100) — 100
Impact to net interest revenue (in millions of dollars) $(424) $(435) $(576) $(333) $ 28 $30
Trading Portfolios
Price risk in trading portfolios is monitored using a series of measures,
including:
• factor sensitivities;
• Value-at-Risk (VAR); and
• Stress testing.
Factor sensitivities are expressed as the change in the value of a position
for a defined change in a market risk factor, such as a change in the value of
a Treasury bill for a one-basis-point change in interest rates. Citigroup’s
independent market risk management ensures that factor sensitivities are
calculated, monitored and, in most cases, limited, for all relevant risks taken
in a trading portfolio.
VAR estimates the potential decline in the value of a position or a portfolio
under normal market conditions. The VAR method incorporates the factor
sensitivities of the trading portfolio with the volatilities and correlations of
those factors and is expressed as the risk to the Company over a one-day
holding period, at a 99% confidence level. Citigroup’s VAR is based on the
volatilities of and correlations among a multitude of market risk factors as
well as factors that track the specific issuer risk in debt and equity securities.
Stress testing is performed on trading portfolios on a regular basis to
estimate the impact of extreme market movements. It is performed on both
individual trading portfolios, and on aggregations of portfolios and
businesses. Independent market risk management, in conjunction with the
businesses, develops stress scenarios, reviews the output of periodic stress
testing exercises, and uses the information to make judgments as to the
ongoing appropriateness of exposure levels and limits.
Each trading portfolio has its own market risk limit framework
encompassing these measures and other controls, including permitted
product lists and a new product approval process for complex products.
73