Citibank 2008 Annual Report Download - page 61
Download and view the complete annual report
Please find page 61 of the 2008 Citibank annual report below. You can navigate through the pages in the report by either clicking on the pages listed below, or by using the keyword search tool below to find specific information within the annual report.-
 1
1 -
2
-
3
-
4
-
5
-
6
-
7
-
8
-
9
-
10
-
11
-
12
-
13
-
14
-
15
-
16
-
17
-
18
-
19
-
20
-
21
-
22
-
23
-
24
-
25
-
26
-
27
-
28
-
29
-
30
-
31
-
32
-
33
-
34
-
35
-
36
-
37
-
38
-
39
-
40
-
41
-
42
-
43
-
44
-
45
-
46
-
47
-
48
-
49
-
50
-
 51
51 -
 52
52 -
 53
53 -
 54
54 -
 55
55 -
 56
56 -
 57
57 -
 58
58 -
 59
59 -
 60
60 -
 61
61 -
 62
62 -
 63
63 -
 64
64 -
 65
65 -
 66
66 -
 67
67 -
 68
68 -
 69
69 -
 70
70 -
 71
71 -
72
-
73
-
74
-
75
-
76
-
77
-
78
-
79
-
80
-
81
-
82
-
83
-
84
-
85
-
86
-
87
-
88
-
89
-
90
-
91
-
92
-
93
-
94
-
95
-
96
-
97
-
98
-
99
-
100
-
101
-
102
-
103
-
104
-
105
-
106
-
107
-
108
-
109
-
110
-
111
-
112
-
113
-
114
-
115
-
116
-
117
-
118
-
119
-
120
-
121
-
122
-
123
-
124
-
125
-
126
-
127
-
128
-
129
-
130
-
131
-
132
-
133
-
134
-
135
-
136
-
137
-
138
-
139
-
140
-
141
-
142
-
143
-
144
-
145
-
146
-
147
-
148
-
149
-
150
-
151
-
152
-
153
-
154
-
155
-
156
-
157
-
158
-
159
-
160
-
161
-
162
-
163
-
164
-
165
-
166
-
167
-
168
-
169
-
170
-
171
-
172
-
173
-
174
-
175
-
176
-
177
-
178
-
179
-
180
-
181
-
182
-
183
-
184
-
185
-
186
-
187
-
188
-
189
-
190
-
191
-
192
-
193
-
194
-
195
-
196
-
197
-
198
-
199
-
200
-
201
-
202
-
203
-
204
-
205
-
206
-
207
-
208
-
209
-
210
-
211
-
212
-
213
-
214
-
215
-
216
-
217
-
218
-
219
-
220
-
221
-
222
-
223
-
224
-
225
-
226
-
227
-
228
-
229
-
230
-
231
-
232
-
233
-
234
-
235
-
236
-
237
-
238
-
239
-
240
-
241
-
242
-
243
-
244
-
245
-
246
-
247
-
248
-
249
-
250
-
251
-
252
 |
 |

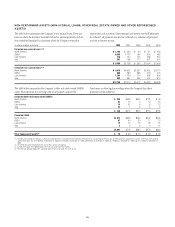
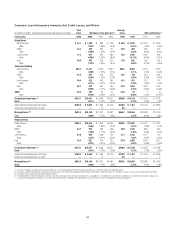
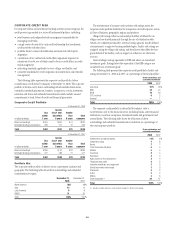
NON-PERFORMING ASSETS (NON-ACCRUAL LOANS, OTHER REAL ESTATE OWNED AND OTHER REPOSSESSED
ASSETS)
The table below summarizes the Company’s non-accrual loans. These are
loans in which the borrower has fallen behind in interest payments and are
now considered impaired. In situations where the Company reasonably
expects that only a portion of the principal and interest owed will ultimately
be collected, all payments received are reflected as a reduction of principal
and not as interest income.
In millions of dollars at year end 2008 2007 2006 2005 2004
Corporate non-accrual loans (1)(2)
North America $ 2,160 $ 290 $ 59 $ 81 $ 253
EMEA 6,630 1,173 186 354 482
Latin America 238 127 173 268 657
Asia 541 168 117 301 514
$ 9,569 $1,758 $ 535 $1,004 $1,906
Consumer non-accrual loans (1)(3)
North America $ 9,876 $4,925 $2,557 $2,425 $3,717
EMEA 886 589 588 430 473
Latin America 1,284 1,129 774 668 654
Asia 682 567 593 497 619
$12,728 $7,210 $4,512 $4,020 $5,463
The table below summarizes the Company’s other real estate owned (OREO)
assets. This represents the carrying value of all property acquired by
foreclosure or other legal proceedings when the Company has taken
possession of the collateral.
Corporate other real estate owned (OREO)
North America $ 246 $448 $302 $126 $ 93
EMEA 23 12 5 12 16
Latin America 14 51 6 8 12
Asia 53 1345
$ 336 $512 $316 $150 $126
Consumer OREO
North America $1,013 $658 $339 $232 $262
EMEA 67 40 30 17 13
Latin America 15 15 13 26 34
Asia 233411
$1,097 $716 $385 $279 $320
Other repossessed assets(4) $78 $99 $75 $62 $93
(1) Excludes purchased distressed loans as they are accreting interest in accordance with Statement of Position 03-3, “Accounting for Certain Loans on Debt Securities Acquired in a Transfer” (SOP 03-3). The carrying
value of these loans was $1.510 billion at December 31, 2008, $2.373 billion at December 31, 2007, $949 million at December 31, 2006, $1.120 billion at December 31, 2005 and $1.213 billion at December 31,
2004.
(2) For further discussion of Corporate non-accrual loans, please see page 67.
(3) Includes the impact of the deterioration in the U.S. consumer real estate market.
(4) Primarily transportation equipment, carried at lower of cost or fair value, less costs to sell.
55