Citibank 2008 Annual Report Download - page 31
Download and view the complete annual report
Please find page 31 of the 2008 Citibank annual report below. You can navigate through the pages in the report by either clicking on the pages listed below, or by using the keyword search tool below to find specific information within the annual report.-
 1
1 -
2
-
3
-
4
-
5
-
6
-
7
-
8
-
9
-
10
-
11
-
12
-
13
-
14
-
15
-
16
-
17
-
18
-
19
-
20
-
 21
21 -
 22
22 -
 23
23 -
 24
24 -
 25
25 -
 26
26 -
 27
27 -
 28
28 -
 29
29 -
 30
30 -
 31
31 -
 32
32 -
 33
33 -
 34
34 -
 35
35 -
 36
36 -
 37
37 -
 38
38 -
 39
39 -
 40
40 -
 41
41 -
42
-
43
-
44
-
45
-
46
-
47
-
48
-
49
-
50
-
51
-
52
-
53
-
54
-
55
-
56
-
57
-
58
-
59
-
60
-
61
-
62
-
63
-
64
-
65
-
66
-
67
-
68
-
69
-
70
-
71
-
72
-
73
-
74
-
75
-
76
-
77
-
78
-
79
-
80
-
81
-
82
-
83
-
84
-
85
-
86
-
87
-
88
-
89
-
90
-
91
-
92
-
93
-
94
-
95
-
96
-
97
-
98
-
99
-
100
-
101
-
102
-
103
-
104
-
105
-
106
-
107
-
108
-
109
-
110
-
111
-
112
-
113
-
114
-
115
-
116
-
117
-
118
-
119
-
120
-
121
-
122
-
123
-
124
-
125
-
126
-
127
-
128
-
129
-
130
-
131
-
132
-
133
-
134
-
135
-
136
-
137
-
138
-
139
-
140
-
141
-
142
-
143
-
144
-
145
-
146
-
147
-
148
-
149
-
150
-
151
-
152
-
153
-
154
-
155
-
156
-
157
-
158
-
159
-
160
-
161
-
162
-
163
-
164
-
165
-
166
-
167
-
168
-
169
-
170
-
171
-
172
-
173
-
174
-
175
-
176
-
177
-
178
-
179
-
180
-
181
-
182
-
183
-
184
-
185
-
186
-
187
-
188
-
189
-
190
-
191
-
192
-
193
-
194
-
195
-
196
-
197
-
198
-
199
-
200
-
201
-
202
-
203
-
204
-
205
-
206
-
207
-
208
-
209
-
210
-
211
-
212
-
213
-
214
-
215
-
216
-
217
-
218
-
219
-
220
-
221
-
222
-
223
-
224
-
225
-
226
-
227
-
228
-
229
-
230
-
231
-
232
-
233
-
234
-
235
-
236
-
237
-
238
-
239
-
240
-
241
-
242
-
243
-
244
-
245
-
246
-
247
-
248
-
249
-
250
-
251
-
252
 |
 |

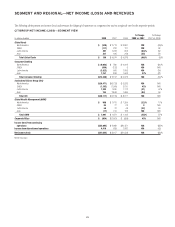
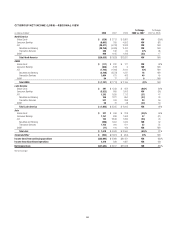
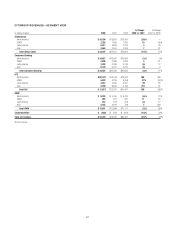
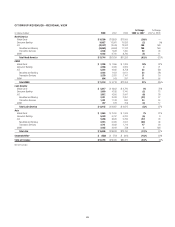
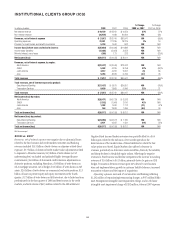
SEGMENT AND REGIONAL—NET INCOME (LOSS) AND REVENUES
The following tables present net income (loss) and revenues for Citigroup’s businesses on a segment view and on a regional view for the respective periods:
CITIGROUP NET INCOME (LOSS)—SEGMENT VIEW
In millions of dollars 2008 2007 2006
% Change
2008 vs. 2007
% Change
2007 vs. 2006
Global Cards
North America $ (529) $ 2,713 $ 3,887 NM (30)%
EMEA (117) 232 121 NM 92
Latin America 491 1,233 652 (60)% 89
Asia 321 496 318 (35) 56
Total Global Cards $ 166 $ 4,674 $ 4,978 (96)% (6)%
Consumer Banking
North America $ (9,003) $ 780 $ 4,002 NM (81)%
EMEA (606) (122) 5 NM NM
Latin America (3,822) 660 1,003 NM (34)
Asia 1,151 839 1,063 37% (21)
Total Consumer Banking $(12,280) $ 2,157 $ 6,073 NM (64)%
Institutional Clients Group (ICG)
North America $(20,471) $(6,733) $ 3,533 NM NM
EMEA (1,102) (1,900) 2,010 42% NM
Latin America 1,292 1,630 1,112 (21) 47%
Asia 164 2,848 1,956 (94) 46
Total ICG $(20,117) $(4,155) $ 8,611 NM NM
Global Wealth Management (GWM)
North America $ 968 $ 1,415 $ 1,209 (32)% 17%
EMEA 84 77 23 9NM
Latin America 56 72 48 (22) 50
Asia (17) 410 163 NM NM
Total GWM $ 1,091 $ 1,974 $ 1,443 (45)% 37%
Corporate/Other $ (954) $(1,661) $ (654) 43% NM
Income (loss) from continuing
operations $(32,094) $ 2,989 $20,451 NM (85)%
Income from discontinued operations 4,410 628 1,087 NM (42)
Net income (loss) $(27,684) $ 3,617 $21,538 NM (83)%
NM Not meaningful
25