Citibank 2008 Annual Report Download - page 44
Download and view the complete annual report
Please find page 44 of the 2008 Citibank annual report below. You can navigate through the pages in the report by either clicking on the pages listed below, or by using the keyword search tool below to find specific information within the annual report.-
 1
1 -
2
-
3
-
4
-
5
-
6
-
7
-
8
-
9
-
10
-
11
-
12
-
13
-
14
-
15
-
16
-
17
-
18
-
19
-
20
-
21
-
22
-
23
-
24
-
25
-
26
-
27
-
28
-
29
-
30
-
31
-
32
-
33
-
 34
34 -
 35
35 -
 36
36 -
 37
37 -
 38
38 -
 39
39 -
 40
40 -
 41
41 -
 42
42 -
 43
43 -
 44
44 -
 45
45 -
 46
46 -
 47
47 -
 48
48 -
 49
49 -
 50
50 -
 51
51 -
 52
52 -
 53
53 -
 54
54 -
55
-
56
-
57
-
58
-
59
-
60
-
61
-
62
-
63
-
64
-
65
-
66
-
67
-
68
-
69
-
70
-
71
-
72
-
73
-
74
-
75
-
76
-
77
-
78
-
79
-
80
-
81
-
82
-
83
-
84
-
85
-
86
-
87
-
88
-
89
-
90
-
91
-
92
-
93
-
94
-
95
-
96
-
97
-
98
-
99
-
100
-
101
-
102
-
103
-
104
-
105
-
106
-
107
-
108
-
109
-
110
-
111
-
112
-
113
-
114
-
115
-
116
-
117
-
118
-
119
-
120
-
121
-
122
-
123
-
124
-
125
-
126
-
127
-
128
-
129
-
130
-
131
-
132
-
133
-
134
-
135
-
136
-
137
-
138
-
139
-
140
-
141
-
142
-
143
-
144
-
145
-
146
-
147
-
148
-
149
-
150
-
151
-
152
-
153
-
154
-
155
-
156
-
157
-
158
-
159
-
160
-
161
-
162
-
163
-
164
-
165
-
166
-
167
-
168
-
169
-
170
-
171
-
172
-
173
-
174
-
175
-
176
-
177
-
178
-
179
-
180
-
181
-
182
-
183
-
184
-
185
-
186
-
187
-
188
-
189
-
190
-
191
-
192
-
193
-
194
-
195
-
196
-
197
-
198
-
199
-
200
-
201
-
202
-
203
-
204
-
205
-
206
-
207
-
208
-
209
-
210
-
211
-
212
-
213
-
214
-
215
-
216
-
217
-
218
-
219
-
220
-
221
-
222
-
223
-
224
-
225
-
226
-
227
-
228
-
229
-
230
-
231
-
232
-
233
-
234
-
235
-
236
-
237
-
238
-
239
-
240
-
241
-
242
-
243
-
244
-
245
-
246
-
247
-
248
-
249
-
250
-
251
-
252
 |
 |

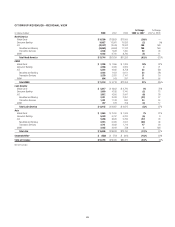
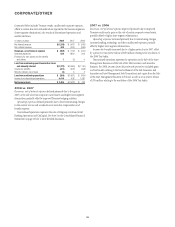
CORPORATE/OTHER
Corporate/Other includes Treasury results, unallocated corporate expenses,
offsets to certain line-item reclassifications reported in the business segments
(inter-segment eliminations), the results of discontinued operations and
unallocated taxes.
In millions of dollars 2008 2007 2006
Net interest revenue $(1,288) $ (461) $ (345)
Non-interest revenue 438 (291) (599)
Revenues, net of interest expense $ (850) $ (752) $ (944)
Operating expenses 526 1,830 202
Provisions for loan losses and for benefits
and claims 1(2) 4
Loss from continuing operations before taxes
and minority interest $(1,377) $(2,580) $(1,150)
Income tax benefits (421) (922) (498)
Minority interest, net of taxes (2) 32
Loss from continuing operations $ (954) $(1,661) $ (654)
Income from discontinued operations 4,410 628 1,087
Net income (loss) $ 3,456 $(1,033) $ 433
2008 vs. 2007
Revenues, net of interest expense declined primarily due to the gain in
2007 on the sale of certain corporate-owned assets and higher inter-segment
eliminations partially offset by improved Treasury hedging activities.
Operating expenses declined primarily due to lower restructuring charges
in the current year as well as reductions in incentive compensation and
benefits expense.
Discontinued operations represent the sale of Citigroup’s German Retail
Banking Operations and CitiCapital. See Note 3 to the Consolidated Financial
Statements on page 136 for a more detailed discussion.
2007 vs. 2006
Revenues, net of interest expense improved primarily due to improved
Treasury results and a gain on the sale of certain corporate-owned assets,
partially offset by higher inter-segment eliminations.
Operating expenses increased primarily due to restructuring charges,
increased staffing, technology and other unallocated expenses, partially
offset by higher inter-segment eliminations.
Income tax benefits increased due to a higher pretax loss in 2007, offset
by a prior-year tax reserve release of $69 million relating to the resolution of
the 2006 Tax Audits.
Discontinued operations represent the operations in the Sale of the Asset
Management Business and the Sale of the Life Insurance and Annuities
Business. For 2006, Income from discontinued operations included gains
and tax benefits relating to the final settlement of the Life Insurance and
Annuities and Asset Management Sale Transactions and a gain from the Sale
of the Asset Management Business in Poland, as well as a tax reserve release
of $76 million relating to the resolution of the 2006 Tax Audits.
38