Citibank 2008 Annual Report Download - page 63
Download and view the complete annual report
Please find page 63 of the 2008 Citibank annual report below. You can navigate through the pages in the report by either clicking on the pages listed below, or by using the keyword search tool below to find specific information within the annual report.-
 1
1 -
2
-
3
-
4
-
5
-
6
-
7
-
8
-
9
-
10
-
11
-
12
-
13
-
14
-
15
-
16
-
17
-
18
-
19
-
20
-
21
-
22
-
23
-
24
-
25
-
26
-
27
-
28
-
29
-
30
-
31
-
32
-
33
-
34
-
35
-
36
-
37
-
38
-
39
-
40
-
41
-
42
-
43
-
44
-
45
-
46
-
47
-
48
-
49
-
50
-
51
-
52
-
 53
53 -
 54
54 -
 55
55 -
 56
56 -
 57
57 -
 58
58 -
 59
59 -
 60
60 -
 61
61 -
 62
62 -
 63
63 -
 64
64 -
 65
65 -
 66
66 -
 67
67 -
 68
68 -
 69
69 -
 70
70 -
 71
71 -
 72
72 -
 73
73 -
74
-
75
-
76
-
77
-
78
-
79
-
80
-
81
-
82
-
83
-
84
-
85
-
86
-
87
-
88
-
89
-
90
-
91
-
92
-
93
-
94
-
95
-
96
-
97
-
98
-
99
-
100
-
101
-
102
-
103
-
104
-
105
-
106
-
107
-
108
-
109
-
110
-
111
-
112
-
113
-
114
-
115
-
116
-
117
-
118
-
119
-
120
-
121
-
122
-
123
-
124
-
125
-
126
-
127
-
128
-
129
-
130
-
131
-
132
-
133
-
134
-
135
-
136
-
137
-
138
-
139
-
140
-
141
-
142
-
143
-
144
-
145
-
146
-
147
-
148
-
149
-
150
-
151
-
152
-
153
-
154
-
155
-
156
-
157
-
158
-
159
-
160
-
161
-
162
-
163
-
164
-
165
-
166
-
167
-
168
-
169
-
170
-
171
-
172
-
173
-
174
-
175
-
176
-
177
-
178
-
179
-
180
-
181
-
182
-
183
-
184
-
185
-
186
-
187
-
188
-
189
-
190
-
191
-
192
-
193
-
194
-
195
-
196
-
197
-
198
-
199
-
200
-
201
-
202
-
203
-
204
-
205
-
206
-
207
-
208
-
209
-
210
-
211
-
212
-
213
-
214
-
215
-
216
-
217
-
218
-
219
-
220
-
221
-
222
-
223
-
224
-
225
-
226
-
227
-
228
-
229
-
230
-
231
-
232
-
233
-
234
-
235
-
236
-
237
-
238
-
239
-
240
-
241
-
242
-
243
-
244
-
245
-
246
-
247
-
248
-
249
-
250
-
251
-
252
 |
 |

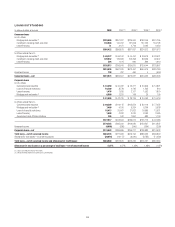
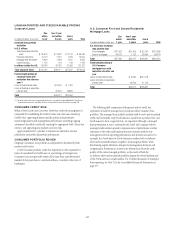
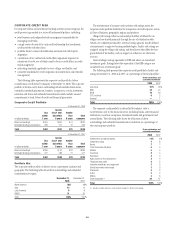
LOAN MATURITIES AND FIXED/VARIABLE PRICING
Corporate Loans
In millions of dollars at year end
Due
within
1 year
Over 1 year
but within
5 years
Over 5
years Total
Corporate loan portfolio
maturities
In U.S. offices:
Commercial and industrial
loans $ 25,913 $ 3,827 $ 3,710 $ 33,450
Financial institutions 8,110 1,061 1,029 10,200
Mortgage and real estate 3,690 1,609 1,261 6,560
Lease financing 1,173 154 149 1,476
In offices outside the U.S. 63,249 42,760 21,508 127,517
Total corporate loans $102,135 $49,411 $27,657 $179,203
Fixed/variable pricing of
corporate loans with
maturities due after one
year (1)
Loans at fixed interest rates $ 6,904 $ 7,764
Loans at floating or adjustable
interest rates 42,507 19,893
Total $49,411 $27,657
(1) Based on contractual terms. Repricing characteristics may effectively be modified from time to time
using derivative contracts. See Note 24 to the Consolidated Financial Statements on page 189.
U.S. Consumer First and Second Residential
Mortgage Loans
In millions of dollars at year end
Due
within
1 year
Over 1 year
but within
5 years
Over 5
years Total
U.S. Consumer mortgage
loan portfolio type
First mortgages $17,423 $51,495 $ 92,167 $161,085
Second mortgages 30,073 1,752 36,654 68,479
Total $47,496 $53,247 $128,821 $229,564
Fixed/variable pricing of
U.S. Consumer
mortgage loans with
maturities due after one
year
Loans at fixed interest rates $ 6,984 $107,078
Loans at floating or adjustable
interest rates 46,263 21,743
Total $53,247 $128,821
CONSUMER CREDIT RISK
Within Global Cards and Consumer Banking, credit risk management is
responsible for establishing the Global Cards and Consumer Banking
Credit Policy, approving business-specific policies and procedures,
monitoring business risk management performance, providing ongoing
assessment of portfolio credit risk, ensuring the appropriate level of loan loss
reserves, and approving new products and new risks.
Approval policies for a product or business are tailored to internal
profitability and credit risk portfolio performance.
CONSUMER PORTFOLIO REVIEW
Citigroup’s consumer loan portfolio is comparatively diversified by both
product and location.
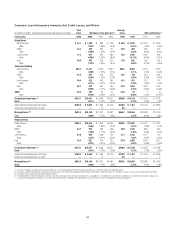
In the Consumer portfolio, credit loss experience is often expressed in
terms of annualized net credit losses as a percentage of average loans.
Consumer loans are generally written off no later than a predetermined
number of days past due on a contractual basis, or earlier in the event of
bankruptcy.
The following table summarizes delinquency and net credit loss
experience in both the managed and on-balance-sheet consumer loan
portfolios. The managed loan portfolio includes held-for-sale and securitized
credit card receivables. Only North America Cards from a product view, and
North America from a regional view, are impacted. Although a managed
basis presentation is not in conformity with GAAP, the Company believes
managed credit statistics provide a representation of performance and key
indicators of the credit card business that are consistent with the way
management reviews operating performance and allocates resources. For
example, the North America Cards business considers both on-balance-
sheet and securitized balances (together, its managed portfolio) when
determining capital allocation and general management decisions and
compensation. Furthermore, investors use information about the credit
quality of the entire managed portfolio, as the results of both the
on-balance-sheet and securitized portfolios impact the overall performance
of the North America Cards business. For a further discussion of managed-
basis reporting, see Note 23 to the Consolidated Financial Statements on
page 175.
57