Citibank 2008 Annual Report Download - page 40
Download and view the complete annual report
Please find page 40 of the 2008 Citibank annual report below. You can navigate through the pages in the report by either clicking on the pages listed below, or by using the keyword search tool below to find specific information within the annual report.-
 1
1 -
2
-
3
-
4
-
5
-
6
-
7
-
8
-
9
-
10
-
11
-
12
-
13
-
14
-
15
-
16
-
17
-
18
-
19
-
20
-
21
-
22
-
23
-
24
-
25
-
26
-
27
-
28
-
29
-
 30
30 -
 31
31 -
 32
32 -
 33
33 -
 34
34 -
 35
35 -
 36
36 -
 37
37 -
 38
38 -
 39
39 -
 40
40 -
 41
41 -
 42
42 -
 43
43 -
 44
44 -
 45
45 -
 46
46 -
 47
47 -
 48
48 -
 49
49 -
 50
50 -
51
-
52
-
53
-
54
-
55
-
56
-
57
-
58
-
59
-
60
-
61
-
62
-
63
-
64
-
65
-
66
-
67
-
68
-
69
-
70
-
71
-
72
-
73
-
74
-
75
-
76
-
77
-
78
-
79
-
80
-
81
-
82
-
83
-
84
-
85
-
86
-
87
-
88
-
89
-
90
-
91
-
92
-
93
-
94
-
95
-
96
-
97
-
98
-
99
-
100
-
101
-
102
-
103
-
104
-
105
-
106
-
107
-
108
-
109
-
110
-
111
-
112
-
113
-
114
-
115
-
116
-
117
-
118
-
119
-
120
-
121
-
122
-
123
-
124
-
125
-
126
-
127
-
128
-
129
-
130
-
131
-
132
-
133
-
134
-
135
-
136
-
137
-
138
-
139
-
140
-
141
-
142
-
143
-
144
-
145
-
146
-
147
-
148
-
149
-
150
-
151
-
152
-
153
-
154
-
155
-
156
-
157
-
158
-
159
-
160
-
161
-
162
-
163
-
164
-
165
-
166
-
167
-
168
-
169
-
170
-
171
-
172
-
173
-
174
-
175
-
176
-
177
-
178
-
179
-
180
-
181
-
182
-
183
-
184
-
185
-
186
-
187
-
188
-
189
-
190
-
191
-
192
-
193
-
194
-
195
-
196
-
197
-
198
-
199
-
200
-
201
-
202
-
203
-
204
-
205
-
206
-
207
-
208
-
209
-
210
-
211
-
212
-
213
-
214
-
215
-
216
-
217
-
218
-
219
-
220
-
221
-
222
-
223
-
224
-
225
-
226
-
227
-
228
-
229
-
230
-
231
-
232
-
233
-
234
-
235
-
236
-
237
-
238
-
239
-
240
-
241
-
242
-
243
-
244
-
245
-
246
-
247
-
248
-
249
-
250
-
251
-
252
 |
 |

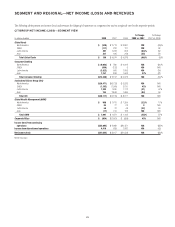
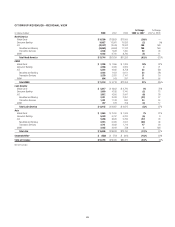
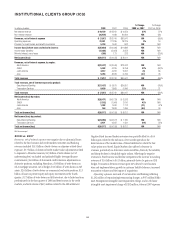
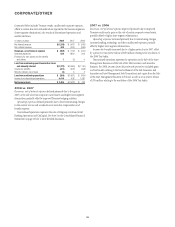
INSTITUTIONAL CLIENTS GROUP (ICG)
In millions of dollars 2008 2007 2006
% Change
2008 vs. 2007
% Change
2007 vs. 2006
Net interest revenue $ 19,159 $12,242 $ 9,653 57% 27%
Non-interest revenue (26,976) 1,498 20,994 NM (93)
Revenues, net of interest expense $ (7,817) $13,740 $30,647 NM (55)%
Operating expenses 22,851 21,236 18,229 8% 16
Provision for credit losses and benefits and claims 5,234 1,540 532 NM NM
Income (loss) before taxes and minority interest $(35,902) $ (9,036) $11,886 NM NM
Income taxes (benefits) (15,405) (5,054) 3,052 NM NM
Minority interest, net of taxes (380) 173 223 NM (22)%
Net income (loss) $(20,117) $ (4,155) $ 8,611 NM NM
Revenues, net of interest expense, by region:
North America $(22,477) $ (3,040) $13,032 NM NM
EMEA 5,592 4,235 8,758 32% (52)%
Latin America 3,812 4,206 3,091 (9) 36
Asia 5,256 8,339 5,766 (37) 45
Total revenues $ (7,817) $13,740 $30,647 NM (55)%
Total revenues, net of interest expense by product:
Securities and Banking $(17,437) $ 5,875 $24,651 NM (76)%
Transaction Services 9,620 7,865 5,996 22% 31
Total revenues $ (7,817) $13,740 $30,647 NM (55)%
Net income (loss) by region:
North America $(20,471) $ (6,733) $ 3,533 NM NM
EMEA (1,102) (1,900) 2,010 42% NM
Latin America 1,292 1,630 1,112 (21) 47%
Asia 164 2,848 1,956 (94) 46
Total net income (loss) $(20,117) $ (4,155) $ 8,611 NM NM
Net income (loss) by product:
Securities and Banking $(23,088) $ (6,377) $ 7,180 NM NM
Transaction Services 2,971 2,222 1,431 34% 55%
Total net income (loss) $(20,117) $ (4,155) $ 8,611 NM NM
NM Not meaningful.
2008 vs. 2007
Revenues, net of interest expense were negative due to substantial losses
related to the fixed income and credit markets. Securities and Banking
revenues included $14.3 billion of write-downs on subprime-related direct
exposure, $5.7 billion of downward credit market value adjustments related
to exposure to Monoline insurers, $4.9 billion of write-downs (net of
underwriting fees) on funded and unfunded highly leveraged finance
commitments, $4.4 billion of downward credit valuation adjustments on
derivative positions, excluding Monolines, $3.8 billion of write-downs on
Alt-A mortgage securities, net of hedges, $3.3 billion of write-downs on SIV
assets, $2.6 billion of write-downs on commercial real estate positions, $2.5
billion of losses in private equity and equity investments in the fourth
quarter, $1.7 billion of write-downs on ARS inventory, due to failed auctions
predominately in the first quarter of 2008 and deterioration in the credit
markets, and write-downs of $413 million related to the ARS settlement.
Negative Fixed Income Markets revenues were partially offset by a $4.6
billion gain related to the inclusion of Citi’s credit spreads in the
determination of the market value of those liabilities for which the fair-
value option was elected. Equity Markets also suffered a decrease in
revenues, particularly in derivatives and convertibles, driven by the volatility
and sharp declines in the global equity indices. Offsetting the negative
revenues in Fixed Income and decline in Equities is the increase in Lending
revenues of $1.6 billion to $4.1 billion, primarily driven by gains on CDS
hedges. Transaction Services revenues grew 22% driven by new business
wins and implementations, growth in customer liability balances, increased
transaction volumes and the impact of acquisitions.
Operating expenses increased 4% in Securities and Banking reflecting
$1,242 million of repositioning/restructuring charges, a $937 million Nikko
Asset Management intangible asset impairment charge, and an Old Lane
intangible asset impairment charge of $202 million, whereas 2007 expenses
34