Citibank 2008 Annual Report Download - page 41
Download and view the complete annual report
Please find page 41 of the 2008 Citibank annual report below. You can navigate through the pages in the report by either clicking on the pages listed below, or by using the keyword search tool below to find specific information within the annual report.-
 1
1 -
2
-
3
-
4
-
5
-
6
-
7
-
8
-
9
-
10
-
11
-
12
-
13
-
14
-
15
-
16
-
17
-
18
-
19
-
20
-
21
-
22
-
23
-
24
-
25
-
26
-
27
-
28
-
29
-
30
-
 31
31 -
 32
32 -
 33
33 -
 34
34 -
 35
35 -
 36
36 -
 37
37 -
 38
38 -
 39
39 -
 40
40 -
 41
41 -
 42
42 -
 43
43 -
 44
44 -
 45
45 -
 46
46 -
 47
47 -
 48
48 -
 49
49 -
 50
50 -
 51
51 -
52
-
53
-
54
-
55
-
56
-
57
-
58
-
59
-
60
-
61
-
62
-
63
-
64
-
65
-
66
-
67
-
68
-
69
-
70
-
71
-
72
-
73
-
74
-
75
-
76
-
77
-
78
-
79
-
80
-
81
-
82
-
83
-
84
-
85
-
86
-
87
-
88
-
89
-
90
-
91
-
92
-
93
-
94
-
95
-
96
-
97
-
98
-
99
-
100
-
101
-
102
-
103
-
104
-
105
-
106
-
107
-
108
-
109
-
110
-
111
-
112
-
113
-
114
-
115
-
116
-
117
-
118
-
119
-
120
-
121
-
122
-
123
-
124
-
125
-
126
-
127
-
128
-
129
-
130
-
131
-
132
-
133
-
134
-
135
-
136
-
137
-
138
-
139
-
140
-
141
-
142
-
143
-
144
-
145
-
146
-
147
-
148
-
149
-
150
-
151
-
152
-
153
-
154
-
155
-
156
-
157
-
158
-
159
-
160
-
161
-
162
-
163
-
164
-
165
-
166
-
167
-
168
-
169
-
170
-
171
-
172
-
173
-
174
-
175
-
176
-
177
-
178
-
179
-
180
-
181
-
182
-
183
-
184
-
185
-
186
-
187
-
188
-
189
-
190
-
191
-
192
-
193
-
194
-
195
-
196
-
197
-
198
-
199
-
200
-
201
-
202
-
203
-
204
-
205
-
206
-
207
-
208
-
209
-
210
-
211
-
212
-
213
-
214
-
215
-
216
-
217
-
218
-
219
-
220
-
221
-
222
-
223
-
224
-
225
-
226
-
227
-
228
-
229
-
230
-
231
-
232
-
233
-
234
-
235
-
236
-
237
-
238
-
239
-
240
-
241
-
242
-
243
-
244
-
245
-
246
-
247
-
248
-
249
-
250
-
251
-
252
 |
 |
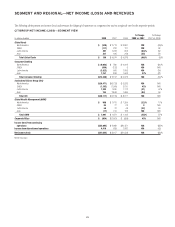
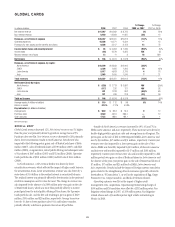
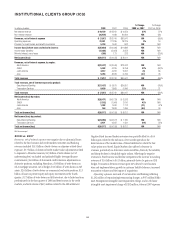
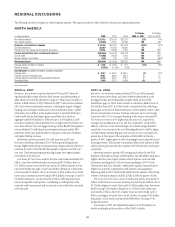
included $370 million of repositioning/restructuring charges, partially offset
by a $300 million release of litigation reserves. Expenses increased 11% in
Transaction Services due to higher expenses driven by organic business
growth, higher variable expenses related to sales and revenue growth, and
the Bisys Group acquisition.
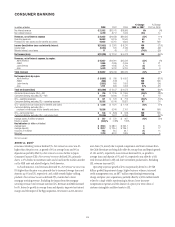
Provisions for credit losses and for benefits and claims in Securities
and Banking increased, primarily from an incremental net charge to
increase loan loss reserves of $2.5 billion, reflecting loan loss reserves for
specific counterparties, as well as a weakening in credit quality in the
corporate credit environment and a $1.1 billion increase in net credit losses
mainly associated with loan sales. Transaction Services credit costs
increased, primarily due to a charge to increase loan loss reserves, mainly
from the commercial banking portfolio in the emerging markets.
2007 vs. 2006
Revenues, net of interest expense decreased 55% driven by $20.7 billion of
pretax write-downs and losses related to deterioration in the mortgage-
backed and credit markets. The losses consisted primarily of approximately
$18.3 billion related to direct subprime-related exposures and write-downs of
approximately $1.5 billion pretax, net of underwriting fees, on funded and
unfunded highly leveraged finance commitments. Of this amount,
approximately $1.3 billion of impairment was recognized for transactions
that had been funded as of December 31, 2007, and $0.2 billion of
impairment was recognized on transactions that were unfunded as of
December 31, 2007. Securities and Banking’s remaining $37.3 billion in U.S.
subprime net direct exposure as of December 31, 2007 consisted of
(a) approximately $8.0 billion of subprime-related exposures in its lending
and structuring business and (b) approximately $29.3 billion of net
exposures to the super senior tranches of CDOs which are collateralized by
asset-backed securities, derivatives on asset-backed securities, or both. The
decreases were offset partially by increased revenues in Equity Markets from
cash trading and strong growth in equity finance, in Advisory from strong
deal volumes, in Equity Underwriting and in Lending. Transaction Services
revenues increased 31% reflecting growth in liability balances, transaction
volumes and assets under custody mainly in Cash Management and
Securities and Funds Services. Average liability balances grew 30% to $247
billion in 2007 as compared to 2006 due to growth across all regions,
reflecting positive flow from new and existing customers.
Operating expenses increased 16% due to higher business volumes,
higher non-incentive compensation staff expenses and increased costs driven
by the Bisys Group, Nikko Cordial, Grupo Cuscatlán, Old Lane and ATD
acquisitions. Operating expenses also increased driven by the
implementation of a headcount reduction plan to reduce ongoing expenses.
This resulted in a $438 million pretax charge to compensation and benefits
in connection with headcount reductions. Expense growth in 2007 was
favorably affected by the absence of a $354 million charge related to the
initial adoption of SFAS 123(R) in 2006 and a $300 million pretax release of
litigation reserves in 2007.
Provisions for credit losses and for benefits and claims increased
approximately $1.0 billion, driven by higher net credit losses, mainly from
loans with subprime-related direct exposure, and a higher net charge to
increase loan loss and unfunded lending commitment reserves reflecting a
slight weakening in overall portfolio credit quality, as well as loan loss
reserves for specific counterparties. Subprime-related loans accounted for
approximately $860 million of credit costs in 2007, of which $704 million
was recorded in the fourth quarter.
OUTLOOK FOR 2009
During 2009, the Company’s Securities and Banking businesses will
continue to be significantly affected by the levels of and volatility in the
global capital markets and economic and political developments, in the U.S.
and globally. Default rates are expected to be at historic highs by the end of
2009 and could negatively impact the cost of credit. Growth in the
transaction services business could be offset by lower interest rates and
continued potential pressure on asset values. See “Outlook for 2009” on
page 7 and “Risk Factors” on page 47.
The Company intends to continue to manage down legacy positions that
have proven illiquid to reduce future losses. The Company’s global
Transaction Services business will continue to focus on generating earnings
growth, leveraging its strong global platform and its ability to innovatively
serve large multinational clients seeking to optimize their working capital.
In addition, Citigroup’s management and reporting realignment will
result in the restructuring of the Securities and Banking businesses, effective
for reporting purposes in the second quarter of 2009, resulting in a focus on
the Company’s core assets, such as its global Transaction Services and
investment banking business, and managing and maximizing the value of
its other legacy assets.
35