Citibank 2008 Annual Report Download - page 92
Download and view the complete annual report
Please find page 92 of the 2008 Citibank annual report below. You can navigate through the pages in the report by either clicking on the pages listed below, or by using the keyword search tool below to find specific information within the annual report.-
 1
1 -
2
-
3
-
4
-
5
-
6
-
7
-
8
-
9
-
10
-
11
-
12
-
13
-
14
-
15
-
16
-
17
-
18
-
19
-
20
-
21
-
22
-
23
-
24
-
25
-
26
-
27
-
28
-
29
-
30
-
31
-
32
-
33
-
34
-
35
-
36
-
37
-
38
-
39
-
40
-
41
-
42
-
43
-
44
-
45
-
46
-
47
-
48
-
49
-
50
-
51
-
52
-
53
-
54
-
55
-
56
-
57
-
58
-
59
-
60
-
61
-
62
-
63
-
64
-
65
-
66
-
67
-
68
-
69
-
70
-
71
-
72
-
73
-
74
-
75
-
76
-
77
-
78
-
79
-
80
-
81
-
 82
82 -
 83
83 -
 84
84 -
 85
85 -
 86
86 -
 87
87 -
 88
88 -
 89
89 -
 90
90 -
 91
91 -
 92
92 -
 93
93 -
 94
94 -
 95
95 -
 96
96 -
 97
97 -
 98
98 -
 99
99 -
 100
100 -
 101
101 -
 102
102 -
103
-
104
-
105
-
106
-
107
-
108
-
109
-
110
-
111
-
112
-
113
-
114
-
115
-
116
-
117
-
118
-
119
-
120
-
121
-
122
-
123
-
124
-
125
-
126
-
127
-
128
-
129
-
130
-
131
-
132
-
133
-
134
-
135
-
136
-
137
-
138
-
139
-
140
-
141
-
142
-
143
-
144
-
145
-
146
-
147
-
148
-
149
-
150
-
151
-
152
-
153
-
154
-
155
-
156
-
157
-
158
-
159
-
160
-
161
-
162
-
163
-
164
-
165
-
166
-
167
-
168
-
169
-
170
-
171
-
172
-
173
-
174
-
175
-
176
-
177
-
178
-
179
-
180
-
181
-
182
-
183
-
184
-
185
-
186
-
187
-
188
-
189
-
190
-
191
-
192
-
193
-
194
-
195
-
196
-
197
-
198
-
199
-
200
-
201
-
202
-
203
-
204
-
205
-
206
-
207
-
208
-
209
-
210
-
211
-
212
-
213
-
214
-
215
-
216
-
217
-
218
-
219
-
220
-
221
-
222
-
223
-
224
-
225
-
226
-
227
-
228
-
229
-
230
-
231
-
232
-
233
-
234
-
235
-
236
-
237
-
238
-
239
-
240
-
241
-
242
-
243
-
244
-
245
-
246
-
247
-
248
-
249
-
250
-
251
-
252
 |
 |

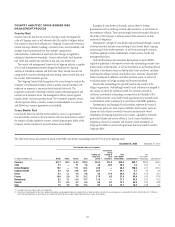
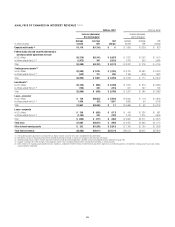
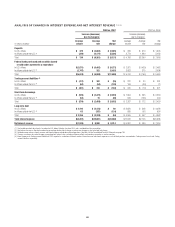
ANALYSIS OF CHANGES IN INTEREST EXPENSE AND NET INTEREST REVENUE (1) (2) (3)
2008 vs. 2007 2007 vs. 2006
Increase (decrease)
due to change in:
Increase (decrease)
due to change in:
In millions of dollars
Average
volume
Average
rate
Net
change
Average
volume
Average
rate
Net
change
Deposits
In U.S. offices $ 479 $ (3,084) $ (2,605) $ 933 $ 670 $ 1,603
In offices outside the U.S. (4) (349) (5,177) (5,526) 3,773 1,690 5,463
Total $ 130 $ (8,261) $ (8,131) $ 4,706 $2,360 $ 7,066
Federal funds purchased and securities loaned
or sold under agreements to repurchase
In U.S. offices $(2,871) $ (6,402) $ (9,273) $ 2,921 $ (439) $ 2,482
In offices outside the U.S. (4) (2,747) 322 (2,425) 2,823 275 3,098
Total $(5,618) $ (6,080) $(11,698) $ 5,744 $ (164) $ 5,580
Trading account liabilities (5)
In U.S. offices $ (417) $ 382 $ (35) $ 231 $ 20 $ 251
In offices outside the U.S. (4) (64) (64) (128) 109 (39) 70
Total $ (481) $ 318 $ (163) $ 340 $ (19) $ 321
Short-term borrowings
In U.S. offices $ (520) $ (2,473) $ (2,993) $ 1,804 $ 235 $ 2,039
In offices outside the U.S. (4) (54) 15 (39) 523 (123) 400
Total $ (574) $ (2,458) $ (3,032) $ 2,327 $ 112 $ 2,439
Long-term debt
In U.S. offices $ 2,193 $ (2,133) $ 60 $ 3,820 $ 508 $ 4,328
In offices outside the U.S. (4) 63 (187) (124) 685 (51) 634
Total $ 2,256 $ (2,320) $ (64) $ 4,505 $ 457 $ 4,962
Total interest expense $(4,287) $(18,801) $(23,088) $17,622 $2,746 $20,368
Net interest revenue $(1,576) $ 9,890 $ 8,314 $ 6,951 $ 499 $ 7,450
(1) The taxable equivalent adjustment is based on the U.S. federal statutory tax rate of 35% and is excluded from this presentation.
(2) Rate/volume variance is allocated based on the percentage relationship of changes in volume and changes in rate to the total net change.
(3) Detailed average volume, interest revenue and interest expense exclude discontinued operations. See Note 3 to the Consolidated Financial Statements on page 136.
(4) Changes in average rates reflect changes in prevailing local interest rates, including inflationary effects and monetary corrections in certain countries.
(5) Interest expense on Trading account liabilities of ICG is reported as a reduction of interest revenue. Interest revenue and interest expense on cash collateral positions are reported in Trading account assets and Trading
account liabilities, respectively.
86