Citibank 2008 Annual Report Download - page 38
Download and view the complete annual report
Please find page 38 of the 2008 Citibank annual report below. You can navigate through the pages in the report by either clicking on the pages listed below, or by using the keyword search tool below to find specific information within the annual report.-
 1
1 -
2
-
3
-
4
-
5
-
6
-
7
-
8
-
9
-
10
-
11
-
12
-
13
-
14
-
15
-
16
-
17
-
18
-
19
-
20
-
21
-
22
-
23
-
24
-
25
-
26
-
27
-
 28
28 -
 29
29 -
 30
30 -
 31
31 -
 32
32 -
 33
33 -
 34
34 -
 35
35 -
 36
36 -
 37
37 -
 38
38 -
 39
39 -
 40
40 -
 41
41 -
 42
42 -
 43
43 -
 44
44 -
 45
45 -
 46
46 -
 47
47 -
 48
48 -
49
-
50
-
51
-
52
-
53
-
54
-
55
-
56
-
57
-
58
-
59
-
60
-
61
-
62
-
63
-
64
-
65
-
66
-
67
-
68
-
69
-
70
-
71
-
72
-
73
-
74
-
75
-
76
-
77
-
78
-
79
-
80
-
81
-
82
-
83
-
84
-
85
-
86
-
87
-
88
-
89
-
90
-
91
-
92
-
93
-
94
-
95
-
96
-
97
-
98
-
99
-
100
-
101
-
102
-
103
-
104
-
105
-
106
-
107
-
108
-
109
-
110
-
111
-
112
-
113
-
114
-
115
-
116
-
117
-
118
-
119
-
120
-
121
-
122
-
123
-
124
-
125
-
126
-
127
-
128
-
129
-
130
-
131
-
132
-
133
-
134
-
135
-
136
-
137
-
138
-
139
-
140
-
141
-
142
-
143
-
144
-
145
-
146
-
147
-
148
-
149
-
150
-
151
-
152
-
153
-
154
-
155
-
156
-
157
-
158
-
159
-
160
-
161
-
162
-
163
-
164
-
165
-
166
-
167
-
168
-
169
-
170
-
171
-
172
-
173
-
174
-
175
-
176
-
177
-
178
-
179
-
180
-
181
-
182
-
183
-
184
-
185
-
186
-
187
-
188
-
189
-
190
-
191
-
192
-
193
-
194
-
195
-
196
-
197
-
198
-
199
-
200
-
201
-
202
-
203
-
204
-
205
-
206
-
207
-
208
-
209
-
210
-
211
-
212
-
213
-
214
-
215
-
216
-
217
-
218
-
219
-
220
-
221
-
222
-
223
-
224
-
225
-
226
-
227
-
228
-
229
-
230
-
231
-
232
-
233
-
234
-
235
-
236
-
237
-
238
-
239
-
240
-
241
-
242
-
243
-
244
-
245
-
246
-
247
-
248
-
249
-
250
-
251
-
252
 |
 |
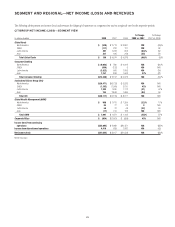
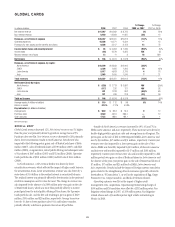
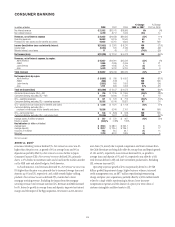
Expenses were up 70% in North America, primarily driven by a $5.107
billion goodwill impairment charge, a $530 million repositioning/
restructuring charge, higher collection and credit-related expenses and
acquisitions. Excluding the goodwill impairment charge and the
repositioning/restructuring charge, expenses increased 1%. EMEA expenses
were up 21% primarily due to the impact of a $203 million goodwill
impairment charge, repositioning/restructuring charges in 2008, partially
offset by a decline in incentive compensation and the benefits from re-
engineering efforts. Expenses increased $4.166 billion in Latin America
primarily driven by a $4.258 billion goodwill impairment charge, prior-year
acquisitions, volume growth and repositioning/restructuring charges in
2008. Partially offsetting the increase was a $221 million benefit related to a
legal vehicle repositioning in Mexico. The 1% growth in Asia was primarily
driven by the acquisition of the Bank of Overseas Chinese and higher volumes,
partially offset by lower expenses in CFJ.
Provisions for credit losses and for benefits and claims increased $8.9
billion, reflecting significantly higher net credit losses in North America,
Mexico and India, as well as a $2.6 billion incremental pretax charge to
increase loan loss reserves, primarily in North America. The growth of the
loan portfolio also contributed to the increase in credit costs.
Credit costs in North America increased by $7.3 billion, due to a $5.1
billion increase in net credit losses and a $2.2 billion increase in loan loss
reserve builds across all portfolios. Higher credit costs reflected a weakening
of leading credit indicators, including higher delinquencies in first and
second mortgages, auto and unsecured personal loans, as well as trends in
the macro-economic environment, including the housing market downturn.
The net credit loss ratio increased 168 bps to 2.72%. EMEA credit costs
increased 33% reflecting deterioration in Western European countries as well
as net credit losses from the Egg acquisition. The net credit loss ratio
increased 57 bps to 2.93%. In Latin America, credit costs increased $394
million, primarily due to higher net credit losses in Mexico. Credit costs in
Asia increased 27% primarily driven by a $234 million incremental pretax
charge to increase loan loss reserves, increased credit costs especially in
India, and portfolio growth.
Asia results include a tax benefit of $850 million in the fourth quarter of
2008, mainly due to the restructuring of legal vehicles in Japan.
2007 vs. 2006
Net interest revenue was 9% higher than the prior year as growth in average
loans and deposits of 15% and 17% respectively, as well as the impact of
acquisitions, was partially offset by a decrease in net interest margin.
Non-interest revenue increased 14%, primarily due to a 17% increase in
investment product sales and the impact of foreign currency translation.
In North America, total revenues increased 9%. Net interest revenue was
9% higher than the prior year, as growth in average loans and deposits, up
14% and 16%, respectively, was partially offset by a decrease in net interest
margin. Net interest margin declined mainly due to an increase in the cost of
funding driven by a shift to higher cost Direct Bank and time deposits.
Non-interest revenue increased 10%, mainly due to the impact of the
acquisition of ABN AMRO in the first quarter of 2007, higher gains on sales
of mortgage loans and growth in net servicing revenues. This increase was
partially offset by the absence of $163 million pretax gain from the sale of
upstate New York branches in the prior-year period. In EMEA, revenues
increased by 21% to $2.5 billion, driven by strong growth in average loans
and deposits and improved net interest margin and the impact of the Egg
acquisition. Revenues in Latin America increased 12% versus the prior year
driven by growth in average loans and deposits of 29% and 14%, respectively,
partially offset by the absence of a prior-year gain on the sale of Avantel of
$234 million. Asia revenues increased 9%, as growth in average loans and
deposits of 13% and 8%, respectively, and higher investment product sales
were offset by a 27% total revenue decline in CFJ. Results in 2007 include a
$261 million pretax charge in CFJ to increase reserves for estimated losses
due to customer settlements.
Consumer Banking Operating expenses increased 12%, reflecting the
impact of acquisitions, volume growth across all regions, and increased
investment spending due to new branch openings. During 2007, 712 Retail
Banking and Consumer Finance branches were opened or acquired.
Expenses also included a $152 million write-down of customer intangibles
and fixed assets in CFJ recorded in the third quarter of 2007. The increase in
expenses was partially offset by savings from the structural expense initiatives
announced in April 2007 and the absence of the charge related to the initial
adoption of SFAS 123(R) in the first quarter of 2006.
North America expenses were up 12%, primarily driven by the ABN AMRO
integration, higher collection costs, higher volume-related expenses, and
increased investment spending due to 202 new branch openings in 2007
(110 in CitiFinancial and 92 in Citibank, N.A.). Expense growth in 2007 was
favorably affected by the absence of the charge related to the initial adoption
of SFAS 123(R) in the prior-year period. EMEA expenses were up 20%
primarily due to business growth, acquisitions and FX translation. Expenses
in Latin America increased 11%, primarily driven by higher business
volumes and the impact of acquisitions. Asia expenses increased 9%,
primarily due to increased investment spending including expansion of the
branch network, partially offset by savings from the structural expense
initiatives.
Provisions for credit losses and for benefits and claims increased $6.9
billion reflecting a $5.1 billion incremental pretax charge to increase loan
loss reserves, primarily in North America, and significantly higher net credit
losses of $1.8 billion. The increase in loan loss reserves reflects a change in
estimate of loan losses inherent in the loan portfolio but not yet visible in
delinquency statistics.
Credit costs in North America increased by $5.6 billion, due to $1.2
billion higher net credit losses and $4.4 billion higher loan loss reserve build.
Higher credit costs reflected a weakening of leading credit indicators
including delinquencies in first and second mortgages and deterioration in
the housing market, a downturn in other economic trends including
unemployment and GDP affecting all other portfolios and a change in
estimate of loan losses inherent in the portfolio but not yet visible in
delinquency statistics. The increase in Provision for loan losses also reflects
the absence of loan loss reserve releases recorded in the prior year. The net
credit loss ratio increased 32 bps to 1.04%. Higher credit costs in EMEA were
due to an increase in net credit losses, up 56%, and an $174 million
incremental net charge to increase loan loss reserves. The net credit loss ratio
increased 28 bps to 2.36%. Credit costs in Latin America increased
substantially driven by a $151 million incremental net charge to increase
loan loss reserves and higher net credit losses. The net credit loss ratio
increased 46 bps to 1.90%. Credit costs in Asia increased 55% primarily
driven by higher net credit losses, primarily in CFJ, and a $317 million
incremental pretax charge to increase loan loss reserves, as well as increased
credit costs especially in India.
32