Citibank 2008 Annual Report Download - page 77
Download and view the complete annual report
Please find page 77 of the 2008 Citibank annual report below. You can navigate through the pages in the report by either clicking on the pages listed below, or by using the keyword search tool below to find specific information within the annual report.-
 1
1 -
2
-
3
-
4
-
5
-
6
-
7
-
8
-
9
-
10
-
11
-
12
-
13
-
14
-
15
-
16
-
17
-
18
-
19
-
20
-
21
-
22
-
23
-
24
-
25
-
26
-
27
-
28
-
29
-
30
-
31
-
32
-
33
-
34
-
35
-
36
-
37
-
38
-
39
-
40
-
41
-
42
-
43
-
44
-
45
-
46
-
47
-
48
-
49
-
50
-
51
-
52
-
53
-
54
-
55
-
56
-
57
-
58
-
59
-
60
-
61
-
62
-
63
-
64
-
65
-
66
-
 67
67 -
 68
68 -
 69
69 -
 70
70 -
 71
71 -
 72
72 -
 73
73 -
 74
74 -
 75
75 -
 76
76 -
 77
77 -
 78
78 -
 79
79 -
 80
80 -
 81
81 -
 82
82 -
 83
83 -
 84
84 -
 85
85 -
 86
86 -
 87
87 -
88
-
89
-
90
-
91
-
92
-
93
-
94
-
95
-
96
-
97
-
98
-
99
-
100
-
101
-
102
-
103
-
104
-
105
-
106
-
107
-
108
-
109
-
110
-
111
-
112
-
113
-
114
-
115
-
116
-
117
-
118
-
119
-
120
-
121
-
122
-
123
-
124
-
125
-
126
-
127
-
128
-
129
-
130
-
131
-
132
-
133
-
134
-
135
-
136
-
137
-
138
-
139
-
140
-
141
-
142
-
143
-
144
-
145
-
146
-
147
-
148
-
149
-
150
-
151
-
152
-
153
-
154
-
155
-
156
-
157
-
158
-
159
-
160
-
161
-
162
-
163
-
164
-
165
-
166
-
167
-
168
-
169
-
170
-
171
-
172
-
173
-
174
-
175
-
176
-
177
-
178
-
179
-
180
-
181
-
182
-
183
-
184
-
185
-
186
-
187
-
188
-
189
-
190
-
191
-
192
-
193
-
194
-
195
-
196
-
197
-
198
-
199
-
200
-
201
-
202
-
203
-
204
-
205
-
206
-
207
-
208
-
209
-
210
-
211
-
212
-
213
-
214
-
215
-
216
-
217
-
218
-
219
-
220
-
221
-
222
-
223
-
224
-
225
-
226
-
227
-
228
-
229
-
230
-
231
-
232
-
233
-
234
-
235
-
236
-
237
-
238
-
239
-
240
-
241
-
242
-
243
-
244
-
245
-
246
-
247
-
248
-
249
-
250
-
251
-
252
 |
 |
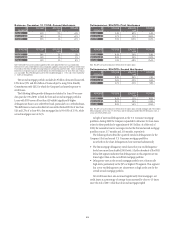
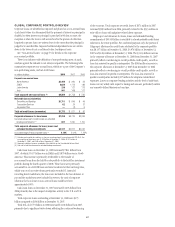
The notional amount of transactions related to the remaining
non-subprime trading assets as of December 31, 2008, was $6.9 billion with
a corresponding fair value exposure of $2.3 billion. The $6.9 billion notional
amount of transactions comprised $1.8 billion primarily in interest-rate
swaps with a corresponding fair value exposure of $3.9 million. The
remaining notional amount of $5.1 billion was in the form of credit default
swaps and total return swaps with a fair value exposure of $2.3 billion.
The notional amount of transactions related to the remaining
non-subprime trading assets at December 31, 2007, was $11.3 billion with a
corresponding fair value exposure of $578 million. The $11.3 billion
notional amount of transactions comprised $4.1 billion primarily in interest-
rate swaps with a fair value exposure of $34 million. The remaining notional
amount of $7.2 billion was in the form of credit default swaps and total
return swaps with a fair value of $544 million.
The Company has purchased mortgage insurance from various monoline
mortgage insurers on first mortgage loans. The notional amount of this
insurance protection was approximately $400 million and $600 million as of
December 31, 2008 and 2007, respectively, with nominal pending claims
against this notional amount.
In addition, Citigroup has indirect exposure to Monolines in various other
parts of its businesses. Indirect exposure includes circumstances in which the
Company is not a contractual counterparty to the Monolines, but instead
owns securities which may benefit from embedded credit enhancements
provided by a Monoline. For example, corporate or municipal bonds in the
trading business may be insured by the Monolines. The previous table does
not capture this type of indirect exposure to the Monolines.
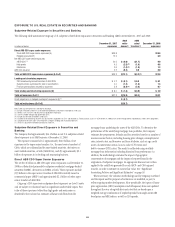
Highly Leveraged Financing Transactions
Highly leveraged financing commitments are agreements that provide
funding to a borrower with higher levels of debt (measured by the ratio of
debt capital to equity capital of the borrower) than is generally the case for
other companies. In recent years through mid-2008, highly leveraged
financing had been commonly employed in corporate acquisitions,
management buy-outs and similar transactions.
In these financings, debt service (that is, principal and interest payments)
absorbs a significant portion of the cash flows generated by the borrower’s
business. Consequently, the risk that the borrower may not be able to meet its
debt obligations is greater. Due to this risk, the interest rates and fees charged
for this type of financing are generally higher than for other types of
financing.
Prior to funding, highly leveraged financing commitments are assessed
for impairment in accordance with SFAS 5, and losses are recorded when
they are probable and reasonably estimable. For the portion of loan
commitments that relates to loans that will be held for investment, loss
estimates are made based on the borrower’s ability to repay the facility
according to its contractual terms. For the portion of loan commitments that
relates to loans that will be held for sale, loss estimates are made in reference
to current conditions in the resale market (both interest rate risk and credit
risk are considered in the estimate). Loan origination, commitment,
underwriting and other fees are netted against any recorded losses.
Citigroup generally manages the risk associated with highly leveraged
financings it has entered into by seeking to sell a majority of its exposures to
the market prior to or shortly after funding. In certain cases, all or a portion
of a highly leveraged financing to be retained is hedged with credit
derivatives or other hedging instruments. Thus, when a highly leveraged
financing is funded, Citigroup records the resulting loan as follows:
• the portion that Citigroup will seek to sell is recorded as a loan
held-for-sale in Other assets on the Consolidated Balance Sheet, and
measured at the lower of cost or market (LOCOM); and
• the portion that will be retained is recorded as a loan held-for-investment
in Loans and measured at amortized cost less a reserve for loan losses.
Due to the dislocation of the credit markets and the reduced market
interest in higher-risk/higher-yield instruments since the latter half of 2007,
liquidity in the market for highly leveraged financings has been limited. This
has resulted in the Company’s recording pretax write-downs on funded and
unfunded highly leveraged finance exposures of $4.9 billion in 2008 and
$1.5 billion in 2007.
Citigroup’s exposures for highly leveraged financing commitments
totaled $10.0 billion at December 31, 2008 ($9.1 billion funded and $0.9
billion in unfunded commitments), reflecting a decrease of $33.2 billion
from December 31, 2007. During the fourth quarter of 2008, Citigroup
reclassified $3.3 billion of funded highly leveraged financings from
held for sale to held for investment as the Company revised the holding
periods for these loans. For further discussion regarding this reclassification,
see “Reclassification of Financial Assets” on page 87.
In April 2008, the Company completed the transfer of approximately $12
billion of loans to third parties, of which $8.5 billion relates to highly
leveraged loans and commitments. In these transactions, the third parties
purchased subordinate interests backed by the transferred loans. These
subordinate interests absorb first loss on the transferred loans and provide
the third parties with control of the loans. The Company retained senior debt
securities backed by the transferred loans. These transactions were accounted
for as sales of the transferred loans. The loans were removed from the
balance sheet and the retained securities are classified as Available-for-sale
securities on the Company’s Consolidated Balance Sheet. The Company’s
sole remaining exposure to the transferred loans are the senior debt
securities and the receivables under the TRS, which have an aggregate
carrying value of $8.1 billion as of December 31, 2008. The Company
purchased protection on these retained senior positions from the third-party
subordinate interest holders via total return swaps. The credit risk in the total
return swap is protected through margin arrangements that provide for both
initial margin and additional margin at specified triggers. Due to the initial
cash margin received and the existing margin requirements on the total
return swaps and the substantive subordinate investments made by third
parties, the Company believes that the transactions largely mitigate the
Company’s risk related to these transferred loans.
71