Citibank 2008 Annual Report Download - page 209
Download and view the complete annual report
Please find page 209 of the 2008 Citibank annual report below. You can navigate through the pages in the report by either clicking on the pages listed below, or by using the keyword search tool below to find specific information within the annual report.-
 1
1 -
2
-
3
-
4
-
5
-
6
-
7
-
8
-
9
-
10
-
11
-
12
-
13
-
14
-
15
-
16
-
17
-
18
-
19
-
20
-
21
-
22
-
23
-
24
-
25
-
26
-
27
-
28
-
29
-
30
-
31
-
32
-
33
-
34
-
35
-
36
-
37
-
38
-
39
-
40
-
41
-
42
-
43
-
44
-
45
-
46
-
47
-
48
-
49
-
50
-
51
-
52
-
53
-
54
-
55
-
56
-
57
-
58
-
59
-
60
-
61
-
62
-
63
-
64
-
65
-
66
-
67
-
68
-
69
-
70
-
71
-
72
-
73
-
74
-
75
-
76
-
77
-
78
-
79
-
80
-
81
-
82
-
83
-
84
-
85
-
86
-
87
-
88
-
89
-
90
-
91
-
92
-
93
-
94
-
95
-
96
-
97
-
98
-
99
-
100
-
101
-
102
-
103
-
104
-
105
-
106
-
107
-
108
-
109
-
110
-
111
-
112
-
113
-
114
-
115
-
116
-
117
-
118
-
119
-
120
-
121
-
122
-
123
-
124
-
125
-
126
-
127
-
128
-
129
-
130
-
131
-
132
-
133
-
134
-
135
-
136
-
137
-
138
-
139
-
140
-
141
-
142
-
143
-
144
-
145
-
146
-
147
-
148
-
149
-
150
-
151
-
152
-
153
-
154
-
155
-
156
-
157
-
158
-
159
-
160
-
161
-
162
-
163
-
164
-
165
-
166
-
167
-
168
-
169
-
170
-
171
-
172
-
173
-
174
-
175
-
176
-
177
-
178
-
179
-
180
-
181
-
182
-
183
-
184
-
185
-
186
-
187
-
188
-
189
-
190
-
191
-
192
-
193
-
194
-
195
-
196
-
197
-
198
-
 199
199 -
 200
200 -
 201
201 -
 202
202 -
 203
203 -
 204
204 -
 205
205 -
 206
206 -
 207
207 -
 208
208 -
 209
209 -
 210
210 -
 211
211 -
 212
212 -
 213
213 -
 214
214 -
 215
215 -
 216
216 -
 217
217 -
 218
218 -
 219
219 -
220
-
221
-
222
-
223
-
224
-
225
-
226
-
227
-
228
-
229
-
230
-
231
-
232
-
233
-
234
-
235
-
236
-
237
-
238
-
239
-
240
-
241
-
242
-
243
-
244
-
245
-
246
-
247
-
248
-
249
-
250
-
251
-
252
 |
 |

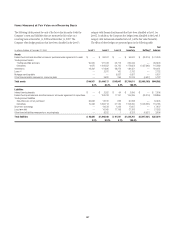
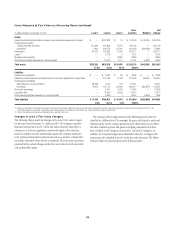
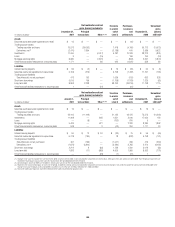
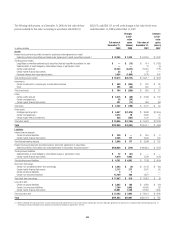
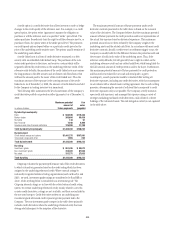
The following table presents, as of December 31, 2008, the fair value of those
positions selected for fair-value accounting in accordance with SFAS 159,
SFAS 156, and SFAS 155, as well as the changes in fair value for the years
ended December 31, 2008 and December 31, 2007.
In millions of dollars
Fair value at
December 31,
2008
Changes
in fair-
value
gains
(losses)
2008
Fair value at
December 31,
2007
Changes
in fair-
value
gains
(losses)
2007
Assets
Federal funds sold and securities borrowed or purchased under agreements to resell
Selected portfolios of securities purchased under agreements to resell, securities borrowed (1) $ 70,305 $ 2,438 $ 84,305 $ 1,462
Trading account assets:
Legg Mason convertible preferred equity securities originally classified as available-for-sale $ — $ (13) $ 614 $ (183)
Selected letters of credit hedged by credit default swaps or participation notes —— 10 (4)
Certain credit products 16,254 (6,272) 26,020 (778)
Certain hybrid financial instruments 33 3 97 —
Retained interests from asset securitizations 3,026 (1,890) 2,476 343
Total trading account assets $ 19,313 $ (8,172) $ 29,217 $ (622)
Investments:
Certain investments in private equity and real estate ventures $ 469 $ (254) $ 539 $ 58
Other 295 (35) 320 9
Total investments $ 764 $ (289) $ 859 $ 67
Loans:
Certain credit products $ 2,315 $ (59) $ 3,038 $ 102
Certain mortgage loans 36 (34) ——
Certain hybrid financial instruments 381 (13) 689 (63)
Total loans $ 2,732 $ (106) $ 3,727 $ 39
Other assets:
Mortgage servicing rights $ 5,657 $ (1,870) $ 8,380 $(1,554)
Certain mortgage loans 4,273 78 6,392 74
Certain equity method investments 936 (362) 1,131 45
Total other assets $ 10,866 $ (2,154) $ 15,903 $(1,435)
Total $103,980 $ (8,283) $134,011 $ (489)
Liabilities
Interest-bearing deposits:
Certain structured liabilities $ 320 $ — $ 264 $ 3
Certain hybrid financial instruments 2,286 177 3,334 129
Total interest-bearing deposits $ 2,606 $ 177 $ 3,598 $ 132
Federal funds purchased and securities loaned or sold under agreements to repurchase
Selected portfolios of securities sold under agreements to repurchase, securities loaned (1) $138,866 $ (319) $199,854 $ (225)
Trading account liabilities:
Selected letters of credit hedged by credit default swaps or participation notes $ 72 $ (81) $— $—
Certain hybrid financial instruments 4,679 4,663 7,228 (409)
Total trading account liabilities $ 4,751 $ 4,582 $ 7,228 $ (409)
Short-term borrowings:
Certain non-collateralized short-term borrowings $ 2,303 $ (9) $ 5,105 $ (64)
Certain hybrid financial instruments 2,112 277 3,561 56
Certain structured liabilities 31 ——
Certain non-structured liabilities 13,189 250 4,821 —
Total short-term borrowings $ 17,607 $ 519 $ 13,487 $ (8)
Long-term debt:
Certain structured liabilities $ 3,083 $ 160 $ 2,952 $ (40)
Certain non-structured liabilities 7,189 3,802 49,095 99
Certain hybrid financial instruments 16,991 3,730 27,265 1,233
Total long-term debt $ 27,263 $ 7,692 $ 79,312 $ 1,292
Total $191,093 $12,651 $303,479 $ 782
(1) Reflects netting of the amounts due from securities purchased under agreements to resell and the amounts owed under securities sold under agreements to repurchase in accordance with FASB Interpretation No. 41,
“Offsetting of Amounts Related to Certain Repurchase and Reverse Repurchase Agreements” (FIN 41).
203