Citibank 2008 Annual Report Download - page 161
Download and view the complete annual report
Please find page 161 of the 2008 Citibank annual report below. You can navigate through the pages in the report by either clicking on the pages listed below, or by using the keyword search tool below to find specific information within the annual report.-
 1
1 -
2
-
3
-
4
-
5
-
6
-
7
-
8
-
9
-
10
-
11
-
12
-
13
-
14
-
15
-
16
-
17
-
18
-
19
-
20
-
21
-
22
-
23
-
24
-
25
-
26
-
27
-
28
-
29
-
30
-
31
-
32
-
33
-
34
-
35
-
36
-
37
-
38
-
39
-
40
-
41
-
42
-
43
-
44
-
45
-
46
-
47
-
48
-
49
-
50
-
51
-
52
-
53
-
54
-
55
-
56
-
57
-
58
-
59
-
60
-
61
-
62
-
63
-
64
-
65
-
66
-
67
-
68
-
69
-
70
-
71
-
72
-
73
-
74
-
75
-
76
-
77
-
78
-
79
-
80
-
81
-
82
-
83
-
84
-
85
-
86
-
87
-
88
-
89
-
90
-
91
-
92
-
93
-
94
-
95
-
96
-
97
-
98
-
99
-
100
-
101
-
102
-
103
-
104
-
105
-
106
-
107
-
108
-
109
-
110
-
111
-
112
-
113
-
114
-
115
-
116
-
117
-
118
-
119
-
120
-
121
-
122
-
123
-
124
-
125
-
126
-
127
-
128
-
129
-
130
-
131
-
132
-
133
-
134
-
135
-
136
-
137
-
138
-
139
-
140
-
141
-
142
-
143
-
144
-
145
-
146
-
147
-
148
-
149
-
150
-
 151
151 -
 152
152 -
 153
153 -
 154
154 -
 155
155 -
 156
156 -
 157
157 -
 158
158 -
 159
159 -
 160
160 -
 161
161 -
 162
162 -
 163
163 -
 164
164 -
 165
165 -
 166
166 -
 167
167 -
 168
168 -
 169
169 -
 170
170 -
 171
171 -
172
-
173
-
174
-
175
-
176
-
177
-
178
-
179
-
180
-
181
-
182
-
183
-
184
-
185
-
186
-
187
-
188
-
189
-
190
-
191
-
192
-
193
-
194
-
195
-
196
-
197
-
198
-
199
-
200
-
201
-
202
-
203
-
204
-
205
-
206
-
207
-
208
-
209
-
210
-
211
-
212
-
213
-
214
-
215
-
216
-
217
-
218
-
219
-
220
-
221
-
222
-
223
-
224
-
225
-
226
-
227
-
228
-
229
-
230
-
231
-
232
-
233
-
234
-
235
-
236
-
237
-
238
-
239
-
240
-
241
-
242
-
243
-
244
-
245
-
246
-
247
-
248
-
249
-
250
-
251
-
252
 |
 |

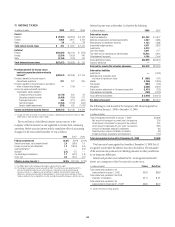
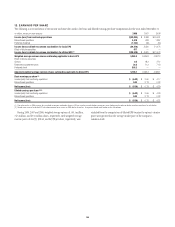
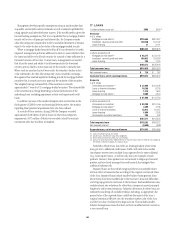
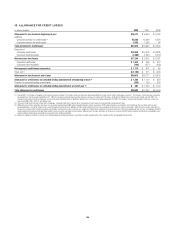
12. EARNINGS PER SHARE
The following is a reconciliation of the income and share data used in the basic and diluted earnings per share computations for the years ended December 31:
In millions, except per share amounts 2008 2007 2006
Income (loss) from continuing operations $(32,094) $ 2,989 $ 20,451
Discontinued operations 4,410 628 1,087
Preferred dividends (1,732) (36) (64)
Income (loss) available to common stockholders for basic EPS (29,416) 3,581 21,474
Effect of dilutive securities 877 ——
Income (loss) available to common stockholders for diluted EPS (1) $(28,539) $ 3,581 $ 21,474
Weighted average common shares outstanding applicable to basic EPS 5,265.4 4,905.8 4,887.3
Effect of dilutive securities:
Options 0.3 18.2 27.2
Restricted and deferred stock 26.2 71.3 71.6
Preferred stock 503.2 ——
Adjusted weighted average common shares outstanding applicable to diluted EPS 5,795.1 4,995.3 4,986.1
Basic earnings per share (2)
Income (loss) from continuing operations $ (6.42) $ 0.60 $ 4.17
Discontinued operations 0.83 0.13 0.22
Net income (loss) $ (5.59) $ 0.73 $ 4.39
Diluted earnings per share (1)(2)
Income (loss) from continuing operations $ (6.42) $ 0.59 $ 4.09
Discontinued operations 0.83 0.13 0.22
Net income (loss) $ (5.59) $ 0.72 $ 4.31
(1) Due to the net loss in 2008, income (loss) available to common stockholders for basic EPS was used to calculate diluted earnings per share. Adding back the effect of dilutive securities would result in anti-dilution.
(2) Diluted shares used in the diluted EPS calculation represent basic shares for 2008 due to the net loss. Using actual diluted shares would result in anti-dilution.
During 2008, 2007 and 2006, weighted average options of 156.1 million,
76.3 million, and 69.1 million shares, respectively, with weighted average
exercise prices of $41.99, $50.40, and $49.98 per share, respectively, were
excluded from the computation of diluted EPS because the options’ exercise
prices were greater than the average market price of the Company’s
common stock.
155