Citibank 2008 Annual Report Download - page 207
Download and view the complete annual report
Please find page 207 of the 2008 Citibank annual report below. You can navigate through the pages in the report by either clicking on the pages listed below, or by using the keyword search tool below to find specific information within the annual report.-
 1
1 -
2
-
3
-
4
-
5
-
6
-
7
-
8
-
9
-
10
-
11
-
12
-
13
-
14
-
15
-
16
-
17
-
18
-
19
-
20
-
21
-
22
-
23
-
24
-
25
-
26
-
27
-
28
-
29
-
30
-
31
-
32
-
33
-
34
-
35
-
36
-
37
-
38
-
39
-
40
-
41
-
42
-
43
-
44
-
45
-
46
-
47
-
48
-
49
-
50
-
51
-
52
-
53
-
54
-
55
-
56
-
57
-
58
-
59
-
60
-
61
-
62
-
63
-
64
-
65
-
66
-
67
-
68
-
69
-
70
-
71
-
72
-
73
-
74
-
75
-
76
-
77
-
78
-
79
-
80
-
81
-
82
-
83
-
84
-
85
-
86
-
87
-
88
-
89
-
90
-
91
-
92
-
93
-
94
-
95
-
96
-
97
-
98
-
99
-
100
-
101
-
102
-
103
-
104
-
105
-
106
-
107
-
108
-
109
-
110
-
111
-
112
-
113
-
114
-
115
-
116
-
117
-
118
-
119
-
120
-
121
-
122
-
123
-
124
-
125
-
126
-
127
-
128
-
129
-
130
-
131
-
132
-
133
-
134
-
135
-
136
-
137
-
138
-
139
-
140
-
141
-
142
-
143
-
144
-
145
-
146
-
147
-
148
-
149
-
150
-
151
-
152
-
153
-
154
-
155
-
156
-
157
-
158
-
159
-
160
-
161
-
162
-
163
-
164
-
165
-
166
-
167
-
168
-
169
-
170
-
171
-
172
-
173
-
174
-
175
-
176
-
177
-
178
-
179
-
180
-
181
-
182
-
183
-
184
-
185
-
186
-
187
-
188
-
189
-
190
-
191
-
192
-
193
-
194
-
195
-
196
-
 197
197 -
 198
198 -
 199
199 -
 200
200 -
 201
201 -
 202
202 -
 203
203 -
 204
204 -
 205
205 -
 206
206 -
 207
207 -
 208
208 -
 209
209 -
 210
210 -
 211
211 -
 212
212 -
 213
213 -
 214
214 -
 215
215 -
 216
216 -
 217
217 -
218
-
219
-
220
-
221
-
222
-
223
-
224
-
225
-
226
-
227
-
228
-
229
-
230
-
231
-
232
-
233
-
234
-
235
-
236
-
237
-
238
-
239
-
240
-
241
-
242
-
243
-
244
-
245
-
246
-
247
-
248
-
249
-
250
-
251
-
252
 |
 |

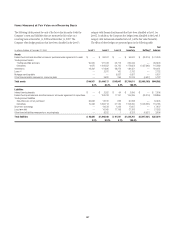
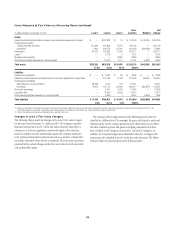
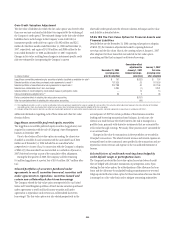
- The increase in Level 3 Short-term borrowings and Long-term debt
of $2.8 billion and $7.3 billion, respectively, resulted from transfers
in of Level 2 positions as prices and other valuation inputs became
unobservable, plus the additions of new issuances for fair value
accounting was elected.
Items Measured at Fair Value on a Nonrecurring Basis
Certain assets and liabilities are measured at fair value on a nonrecurring
basis and therefore are not included in the tables above. These include assets
measured at cost that have been written down to fair value during the
periods as a result of an impairment. In addition, assets such as loans held
for sale that are measured at the lower of cost or market (LOCOM) that were
recognized at fair value below cost at the end of the period.
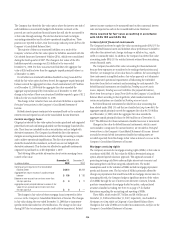
The Company recorded goodwill impairment charges of $9.6 billion as of
December 31, 2008, as determined based on Level 3 inputs. The primary
cause of goodwill impairment was the overall weak industry outlook and
continuing operating losses. These factors contributed to the overall decline
in the stock price and the related market capitalization of Citigroup. See Note
19, “Goodwill and Intangible Assets” on page 166, for additional
information on goodwill impairment.
The Company performed an impairment analysis of intangible assets
related to the Old Lane multi-strategy hedge fund during the first quarter of
2008. As a result, a pre-tax write-down of $202 million, representing the
remaining unamortized balance of the intangible assets, was recorded
during the first quarter of 2008. The measurement of fair value was
determined using Level 3 input factors along with a discounted cash flow
approach.
During the fourth quarter of 2008, the Company performed an
impairment analysis of Japan's Nikko Asset Management fund contracts
which represent the rights to manage and collect fees on investor assets and
are accounted for as indefinite-lived intangible assets. As a result, an
impairment loss of $937 million pre-tax was recorded. The related fair value
was determined using an income approach which relies on key drivers and
future expectations of the business that are considered Level 3 input factors.
The fair value of loans measured on a LOCOM basis is determined where
possible using quoted secondary-market prices. Such loans are generally
classified in Level 2 of the fair-value hierarchy given the level of activity in
the market and the frequency of available quotes. If no such quoted price
exists, the fair value of a loan is determined using quoted prices for a similar
asset or assets, adjusted for the specific attributes of that loan.
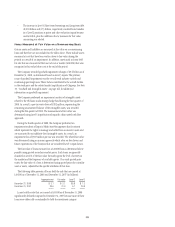
The following table presents all loans held-for-sale that are carried at
LOCOM as of December 31, 2008 and December 31, 2007 (in billions):
Aggregate cost Fair value Level 2 Level 3
December 31, 2008 $ 3.1 $ 2.1 $0.8 $ 1.3
December 31, 2007 33.6 31.9 5.1 26.8
Loans held-for-sale that are carried at LOCOM as of December 31, 2008
significantly declined compared to December 31, 2007 because most of these
loans were either sold or reclassified to held-for-investment category.
201