Citibank 2008 Annual Report Download - page 62
Download and view the complete annual report
Please find page 62 of the 2008 Citibank annual report below. You can navigate through the pages in the report by either clicking on the pages listed below, or by using the keyword search tool below to find specific information within the annual report.-
 1
1 -
2
-
3
-
4
-
5
-
6
-
7
-
8
-
9
-
10
-
11
-
12
-
13
-
14
-
15
-
16
-
17
-
18
-
19
-
20
-
21
-
22
-
23
-
24
-
25
-
26
-
27
-
28
-
29
-
30
-
31
-
32
-
33
-
34
-
35
-
36
-
37
-
38
-
39
-
40
-
41
-
42
-
43
-
44
-
45
-
46
-
47
-
48
-
49
-
50
-
51
-
 52
52 -
 53
53 -
 54
54 -
 55
55 -
 56
56 -
 57
57 -
 58
58 -
 59
59 -
 60
60 -
 61
61 -
 62
62 -
 63
63 -
 64
64 -
 65
65 -
 66
66 -
 67
67 -
 68
68 -
 69
69 -
 70
70 -
 71
71 -
 72
72 -
73
-
74
-
75
-
76
-
77
-
78
-
79
-
80
-
81
-
82
-
83
-
84
-
85
-
86
-
87
-
88
-
89
-
90
-
91
-
92
-
93
-
94
-
95
-
96
-
97
-
98
-
99
-
100
-
101
-
102
-
103
-
104
-
105
-
106
-
107
-
108
-
109
-
110
-
111
-
112
-
113
-
114
-
115
-
116
-
117
-
118
-
119
-
120
-
121
-
122
-
123
-
124
-
125
-
126
-
127
-
128
-
129
-
130
-
131
-
132
-
133
-
134
-
135
-
136
-
137
-
138
-
139
-
140
-
141
-
142
-
143
-
144
-
145
-
146
-
147
-
148
-
149
-
150
-
151
-
152
-
153
-
154
-
155
-
156
-
157
-
158
-
159
-
160
-
161
-
162
-
163
-
164
-
165
-
166
-
167
-
168
-
169
-
170
-
171
-
172
-
173
-
174
-
175
-
176
-
177
-
178
-
179
-
180
-
181
-
182
-
183
-
184
-
185
-
186
-
187
-
188
-
189
-
190
-
191
-
192
-
193
-
194
-
195
-
196
-
197
-
198
-
199
-
200
-
201
-
202
-
203
-
204
-
205
-
206
-
207
-
208
-
209
-
210
-
211
-
212
-
213
-
214
-
215
-
216
-
217
-
218
-
219
-
220
-
221
-
222
-
223
-
224
-
225
-
226
-
227
-
228
-
229
-
230
-
231
-
232
-
233
-
234
-
235
-
236
-
237
-
238
-
239
-
240
-
241
-
242
-
243
-
244
-
245
-
246
-
247
-
248
-
249
-
250
-
251
-
252
 |
 |

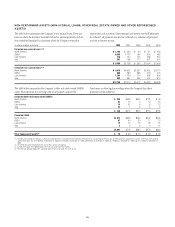
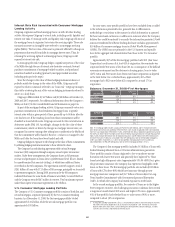
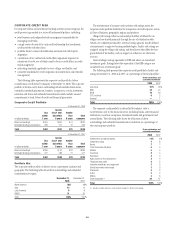
There is no industry-wide definition of non-performing assets. As such,
analysis against the industry is not always comparable. The table below
represents the Company’s view of non-performing assets. As a general rule,
consumer loans are charged off at 120 days past due and credit card loans
are charged off at 180 days contractually past due. Consumer loans secured
with non-real-estate collateral are written down to the estimated value of
the collateral, less costs to sell, at 120 days past due. Consumer real-estate
secured loans are written down to the estimated value of the property, less
costs to sell, when they are 180 days contractually past due. Impaired
corporate loans and leases are written down to the extent that principal is
judged to be uncollectible.
Non-performing assets 2008 2007 2006 2005 2004
Corporate non-accrual loans $ 9,569 $ 1,758 $ 535 $1,004 $1,906
Consumer non-accrual loans 12,728 7,210 4,512 4,020 5,463
Non-accrual loans (NAL) $22,297 $ 8,968 $5,047 $5,024 $7,369
OREO $ 1,433 $ 1,228 $ 701 $ 429 $ 446
Other repossessed assets 78 99 75 62 93
Non-performing assets (NPA) $23,808 $10,295 $5,823 $5,515 $7,908
NAL as a % of total loans 3.21% 1.15% 0.74% 0.86% 1.34%
NPA as a % of total assets 1.22% 0.47% 0.31% 0.37% 0.53%
Allowance for loan losses as a % of NAL(1) 133% 180% 177% 195% 153%
(1) The $6.403 billion of non-accrual loans transferred from the held-for-sale portfolio to the held-for-investment portfolio during the fourth quarter of 2008 were marked-to-market at the transfer date and therefore no
allowance was necessary at the time of the transfer. $2.426 billion of the par value of the loans reclassified was written off prior to transfer.
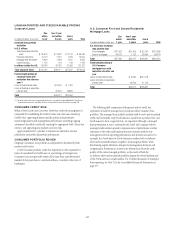
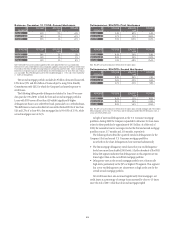
RENEGOTIATED LOANS
In millions of dollars at year end 2008 2007 2006
Renegotiated loans(1)(2)
In U.S. offices $10,031 $5,540 $3,992
In offices outside the U.S. 1,755 1,176 534
$11,786 $6,716 $4,526
(1) Smaller-balance, homogeneous renegotiated loans were derived from our risk management systems.
(2) Also includes Corporate and Commercial Business loans.
FOREGONE INTEREST REVENUE ON LOANS (1)
In millions of dollars
In U.S.
offices
In non-
U.S.
offices
2008
total
Interest revenue that would have been accrued at
original contractual rates (2) $1,245 $827 $2,072
Amount recognized as interest revenue (2) 295 258 553
Foregone interest revenue $ 950 $569 $1,519
(1) Relates to corporate non-accrual, renegotiated loans and consumer loans on which accrual of interest
had been suspended.
(2) Interest revenue in offices outside the U.S. may reflect prevailing local interest rates, including the
effects of inflation and monetary correction in certain countries.
56