Citibank 2008 Annual Report Download - page 70
Download and view the complete annual report
Please find page 70 of the 2008 Citibank annual report below. You can navigate through the pages in the report by either clicking on the pages listed below, or by using the keyword search tool below to find specific information within the annual report.-
 1
1 -
2
-
3
-
4
-
5
-
6
-
7
-
8
-
9
-
10
-
11
-
12
-
13
-
14
-
15
-
16
-
17
-
18
-
19
-
20
-
21
-
22
-
23
-
24
-
25
-
26
-
27
-
28
-
29
-
30
-
31
-
32
-
33
-
34
-
35
-
36
-
37
-
38
-
39
-
40
-
41
-
42
-
43
-
44
-
45
-
46
-
47
-
48
-
49
-
50
-
51
-
52
-
53
-
54
-
55
-
56
-
57
-
58
-
59
-
 60
60 -
 61
61 -
 62
62 -
 63
63 -
 64
64 -
 65
65 -
 66
66 -
 67
67 -
 68
68 -
 69
69 -
 70
70 -
 71
71 -
 72
72 -
 73
73 -
 74
74 -
 75
75 -
 76
76 -
 77
77 -
 78
78 -
 79
79 -
 80
80 -
81
-
82
-
83
-
84
-
85
-
86
-
87
-
88
-
89
-
90
-
91
-
92
-
93
-
94
-
95
-
96
-
97
-
98
-
99
-
100
-
101
-
102
-
103
-
104
-
105
-
106
-
107
-
108
-
109
-
110
-
111
-
112
-
113
-
114
-
115
-
116
-
117
-
118
-
119
-
120
-
121
-
122
-
123
-
124
-
125
-
126
-
127
-
128
-
129
-
130
-
131
-
132
-
133
-
134
-
135
-
136
-
137
-
138
-
139
-
140
-
141
-
142
-
143
-
144
-
145
-
146
-
147
-
148
-
149
-
150
-
151
-
152
-
153
-
154
-
155
-
156
-
157
-
158
-
159
-
160
-
161
-
162
-
163
-
164
-
165
-
166
-
167
-
168
-
169
-
170
-
171
-
172
-
173
-
174
-
175
-
176
-
177
-
178
-
179
-
180
-
181
-
182
-
183
-
184
-
185
-
186
-
187
-
188
-
189
-
190
-
191
-
192
-
193
-
194
-
195
-
196
-
197
-
198
-
199
-
200
-
201
-
202
-
203
-
204
-
205
-
206
-
207
-
208
-
209
-
210
-
211
-
212
-
213
-
214
-
215
-
216
-
217
-
218
-
219
-
220
-
221
-
222
-
223
-
224
-
225
-
226
-
227
-
228
-
229
-
230
-
231
-
232
-
233
-
234
-
235
-
236
-
237
-
238
-
239
-
240
-
241
-
242
-
243
-
244
-
245
-
246
-
247
-
248
-
249
-
250
-
251
-
252
 |
 |

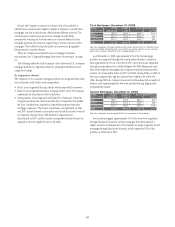
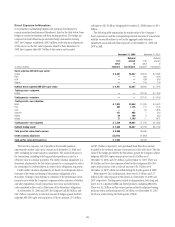
By State
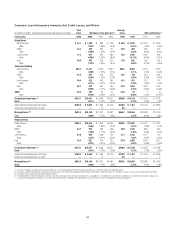
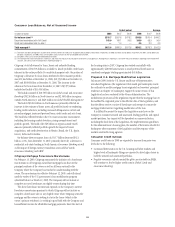
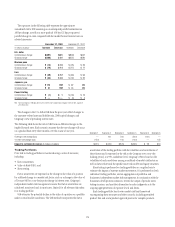
Approximately half of the Company’s U.S. Consumer mortgage portfolio
remains concentrated in five states: California, New York, Florida, Illinois,
and Texas. Those states represent 49% of first mortgages and 57% of second
mortgages.
During 2008, unemployment was the key driver of delinquencies: despite
sharp differences in the quality of their portfolio, California and Florida
experienced above average rises in 90+DPD. California, which has only 3%
of its first mortgage portfolio originated in the FICO<620 band, experienced
a 2.7 times rise in delinquencies, to 4.13%. Florida, which has 21% of its
loans in that FICO band, also suffered a similar rise in delinquencies, albeit
to a much higher rate of 12.24%. Texas, despite having 34% of its portfolio
originated with FICO<620, experienced a relatively mild rise in
delinquencies, a consequence of its below average increase in unemployment
rate.
First Mortgages: December 31, 2008
CALIFORNIA
STATES
(in billions of dollars)
NEW YORK
ILLINOIS
FLORIDA
90+DPD FIRST MORTGAGES
FICO<620
$1.2
$1.0
$1.6
$1.0
STATE
% TOTAL
FIRST
MORTGAGES
$36.1
$9.5
$7.8
$5.8
TEXAS
TOTAL
OTHERS
5.66%
$1.8
$15.7
$22.4100.0%
$5.3
$69.5
26.9%
7.1%
5.8%
4.3%
4.0%
51.9%
4.13%
3.90%
12.24%
6.04%
5.44%
5.94%
$133.9
Note: Data at origination. $134 billion portfolio excludes Canada and Puerto Rico, First Collateral Services
(commercial portfolio), deferred fees/costs, loans held for sale and loans sold with recourse. Excluding
Government insured loans, 90+DPD for the first mortgage portfolio is 5.13%.
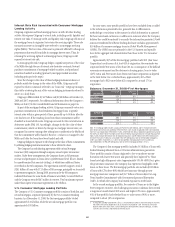
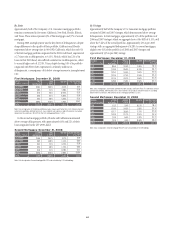
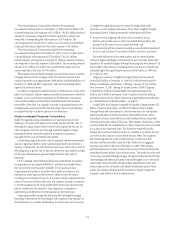
In the second mortgage portfolio, Florida and California maintained
above-average delinquencies, with approximately 18% and 22% of their
loans originated in the LTV ≥90% band.
Second Mortgages: December 31, 2008
CALIFORNIA
STATES
(in billions of dollars)
NEW YORK
ILLINOIS
FLORIDA
90+DPD SECOND MORTGAGES
LTV ≥ 90%
$3.0
$0.9
$1.0
$0.8
STATE
% TOTAL
SECOND
MORTGAGES
$16.6
$8.2
$4.3
$2.4
TEXAS
TOTAL
OTHERS
2.39%
$1.1
$10.4
$17.2100.0%
$1.8
$25.6
28.1%
14.0%
7.3%
4.0%
3.1%
43.4%
3.17%
1.11%
4.72%
1.75%
0.70%
2.08%
$59.0
Note: Data at origination. Second mortgage 90+DPD rate calculated by OTS methodology.
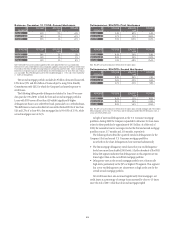
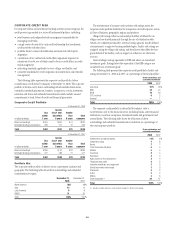
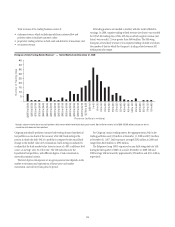
By Vintage
Approximately half of the Company’s U.S. Consumer mortgage portfolio
consisted of 2006 and 2007 vintages, which demonstrated above average
delinquencies. In first mortgages, approximately 45% of the portfolio is of
2006 and 2007 vintages, which on aggregate have a 90+DPD of 8.15%, well
above the 5.66% of the overall portfolio. Approximately 43% is pre-2005
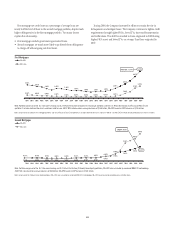
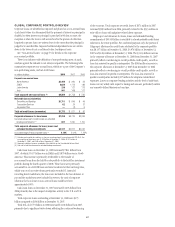
vintage, with an aggregated delinquency of 4.28%. In second mortgages,
slightly over 61% of the portfolio is of 2006 and 2007 vintages and
approximately 33% is pre-2005 vintage.
First Mortgages: December 31, 2008
2008
VINTAGES
(in billions of dollars)
2007
2005
2006
90+DPD FIRST MORTGAGES
FICO<620
$2.5
$6.7
$3.6
$2.4
VINTAGE
% TOTAL
FIRST
MORTGAGES
$16.9
$34.8
$25.2
$23.5
2004
TOTAL
2003
5.66%
$1.8
$5.3
$22.4100.0%
$13.5
$20.0
12.6%
26.0%
18.9%
17.5%
10.1%
15.0%
1.46%
8.39%
7.82%
3.55%
3.68%
5.52%
$133.9
Note: Data at origination. $134 billion portfolio excludes Canada and Puerto Rico, First Collateral Services
(commercial portfolio), deferred fees/costs, loans held for sale and loans sold with recourse. Excluding
Government insured loans, 90+DPD for the first mortgage portfolio is 5.13%.
Second Mortgages: December 31, 2008
2008
VINTAGES
(in billions of dollars)
2007
2005
2006
90+DPD
$0.1
$3.5
$7.6
$4.5
VINTAGE
% TOTAL
SECOND
MORTGAGES
$3.2
$14.5
$21.7
$12.8
2004
TOTAL 2.39%
$1.2
$0.4
$17.2100.0%
$3.9
$2.9
5.4%
24.6%
36.8%
21.7%
6.6%
4.9%
0.13%
1.92%
3.33%
2.51%
1.32%
0.98%
$59.0
SECOND MORTGAGES
LTV ≥ 90%
2003
Note: Data at origination. Second mortgage 90+DPD rate calculated by OTS methodology.
64